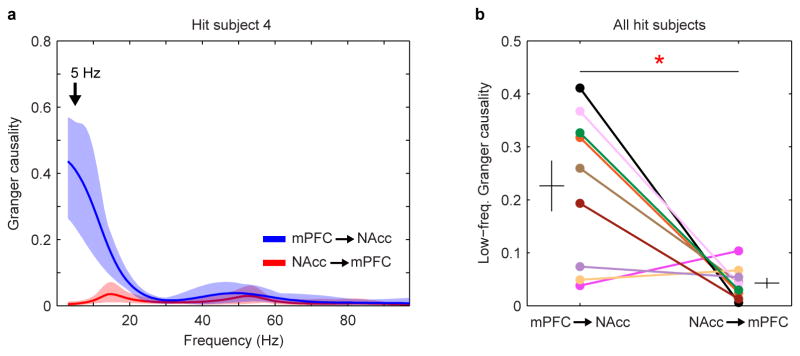
Extended Data Figure 5. Granger causality in mPFC-NAcc circuit during mating.
a, Granger causality spectra in the mPFC-to-NAcc and NAcc-to-mPFC directions for example subject. Solid lines and shaded regions show mean and mid-95 percentile range, respectively, of the n = 40 Granger causality estimates for a given brain-area direction (see Methods). b, Comparison of Granger causality at 5 Hz in the two directions across hit subjects (n = 9). Granger causality is significantly higher in the mPFC-to-NAcc direction (t8 = 3.29, P = 0.011). Error bars show mean ± s.e.m.

