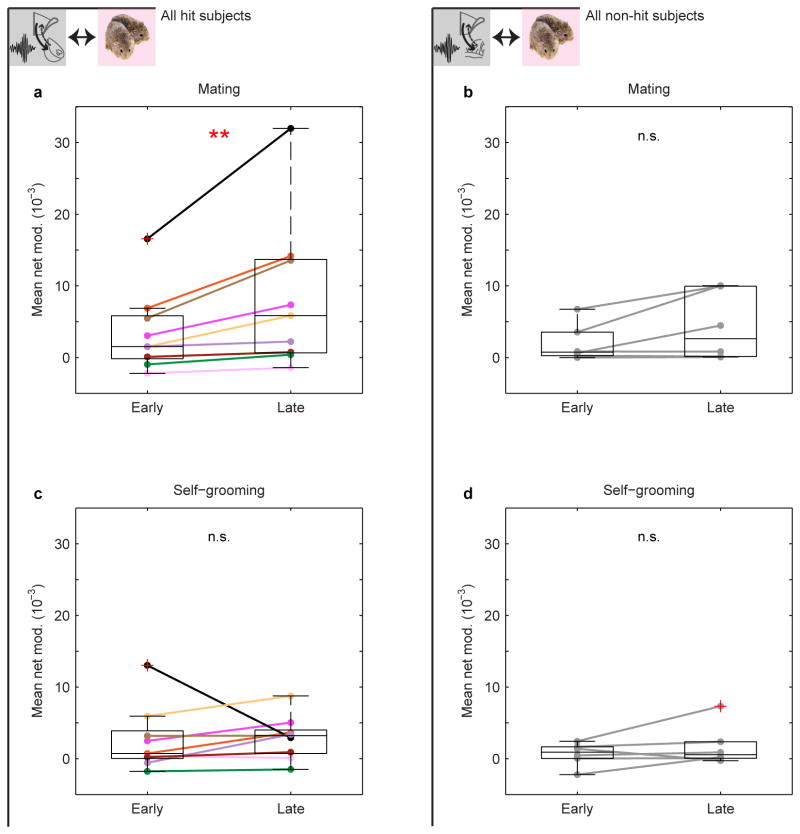
Extended Data Figure 7. Net modulation during early and late mating and self-grooming.
a, Mean net modulation during mating increases over time in hits (n = 9, P = 0.008) but not (b) non-hits (n = 6, P = 0.438). c, Mean net modulation during self-grooming shows no significant change in either hits (P = 0.406) or (d) non-hits (P = 0.438). P-values in a-d are Bonferroni-corrected for multiple comparisons (see Methods). Mean early and late values for mating are derived from the first and last mating bouts. Mean values for self-grooming are derived from early and late self-grooming samples matched in number to the first and last mating bouts (see Methods). Boxplots show median and interquartile range.

