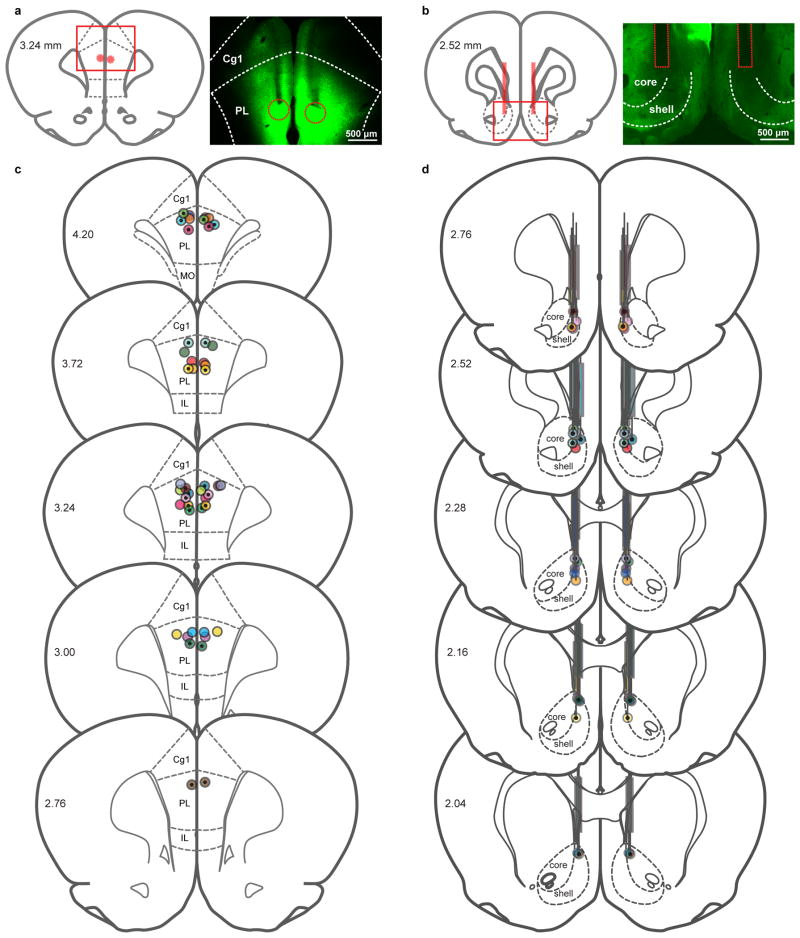
Extended Data Figure 9. Validation of virus injection and optical implant locations.
a, Representative coronal sections showing estimated centers of bilateral virus injection and (b) optical implant placement for in vivo optogenetics subjects. Virus injection localization was based on minor tissue damage at dorsal-most surface of the coronal section where injection syringe initially entered the brain, the densest concentration of fluorescence and physical tracts of damage left by injection syringe. Optical implant localization was based on physical tracts of damage left by optical implant. Morphology of corpus callosum was used to determine anterior/posterior position of injections and implants. c, Virus injection and (d) optical implant locations for all in vivo optogenetics subjects. ChR2-expressing subjects (n = 12) are indicated by circles with dotted centers. Control subjects (n = 11) are indicated by circles with empty centers. Each color is a separate subject, with two circles per subject (bilateral injection and optical implant). All injection center locations fall within the prelimbic cortex and all optical implant locations fall within the medial NAcc. In a-d, the anterior/posterior location of each section (units of rat brain atlas) is indicated on left-hand side of section. IL: infralimbic cortex; MO: medial orbital cortex.

