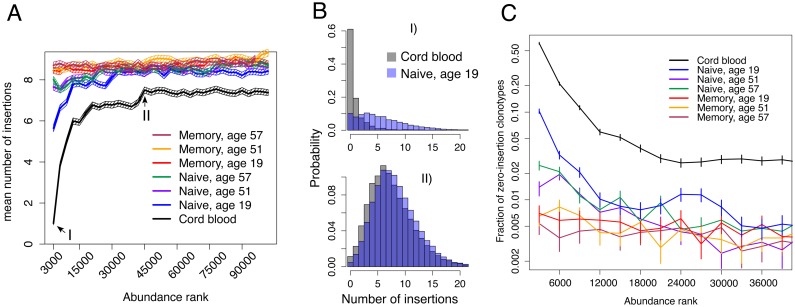
Fig 3. The number of inserted nucleotides in in-frame TCR beta clonotypes depends on their abundance.
A. Mean numbers of insertions were obtained by analysing groups of 3000 sequences of decreasing abundance. Clonotypes from the cord blood (black) show a strong dependence on abundance, with high-abundance clones having much fewer insertions than low-abundance ones. Clonotypes in a young adult naive repertoire (blue) show a similar but less marked trend. Naive clonotypes in older adults (violet and green) show an even weaker trend. Adult memory samples of all ages show no dependence at all (red, yellow and maroon). Error bars show 2 standard errors. B. Probability distributions of the number of insertions in two rank classes, for young naive and cord-blood samples (ranks 1-3000 on top, ranks 45001-48000 on bottom). For high-ranking sequences, the probability of having zero insertions is high both for adult naive and cord blood samples. For middle-ranking sequences, the probability of 0 insertions is much lower, and the distributions are similar between adult naive and cord-blood samples. C. Fraction of clonotypes with zero insertions for different abundance classes. Error bars show one standard deviation. We present the analysis for independently published cord blood donors and different bin sizes in S11 and S10 Figs respectively.

