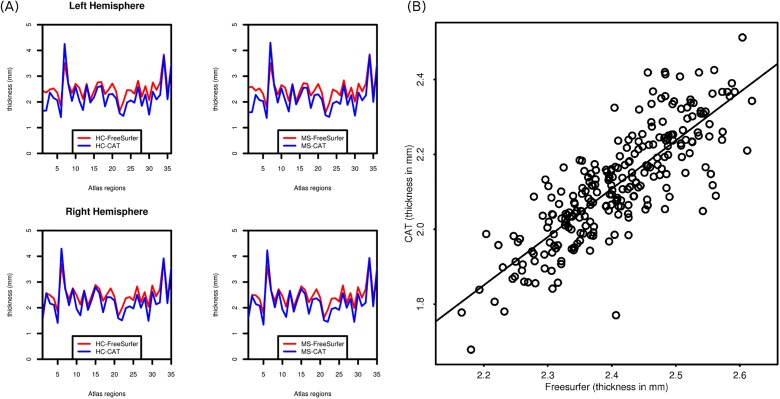
Fig 2.
(a). Thickness values across regions (b) correlation between methods. Thickness across regions was measured using the parcellation atlas provided by FreeSurfer (Desikan et al., 2006). Numbers on the x-axis are the following labels: 1. Bank of STS, 2. Caudal anterior cingulate cortex, 3. Caudal middle frontal cortex, 4. Cuneus, 5. Entorhinal cortex, 6. Frontal pole, 7. Fusiform cortex, 8. Inferior parietal cortex, 9. Inferior temporal cortex, 10. Insula, 11. Isthmus cingulate cortex, 12. Lateral occipital cortex, 13. Lateral orbitofrontal cortex, 14. Lingual cortex, 15. Medial orbitofrontal cortex, 16. Middle temporal cortex, 17.Paracentral lobule, 18. Parahippocampal gyrus, 19–21: Inferior frontal gyrus: 19. Parsopercularis, 20. Parsorbitalis, 21. Parstriangularis, 22. Pericalcarine cortex, 23. Postcentral gyrus, 24. Posterior cingulate cortex, 25. Precentral gyrus, 26. Precuneus, 27. Rostral anterior cingulate, 28. Rostral middle frontal cortex, 29. Superior frontal cortex, 30. Superior parietal cortex, 31. Superior temporal cortex, 32. Supramarginal gyrus, 33. Temporal pole, 34. Transverse temporal cortex.

