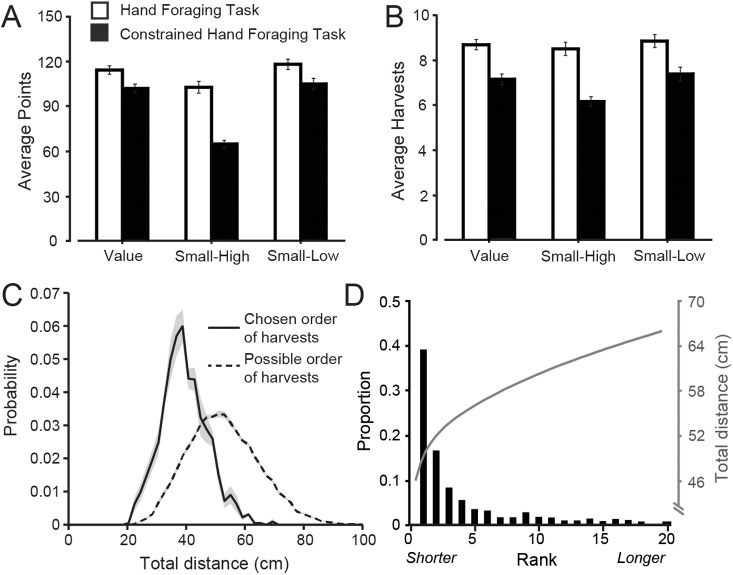
Fig 7. Performance in the constrained hand task.
A-B, Average number of points and harvests, respectively, per trial across the three conditions examined in the constrained hand task. Error bars represent ±1 SE. C, Mean distributions, averaged across participants, of possible path distances (dashed line) and actual path distances (solid line) that participants chose. Shaded areas represent ±1 SE. D, The bars show the proportion of trials in which participants selected the shortest possible path (rank 1), the next shortest path (rank 2), and so on up to the 20th shortest path. The grey line shows the total path length as a function of rank.

