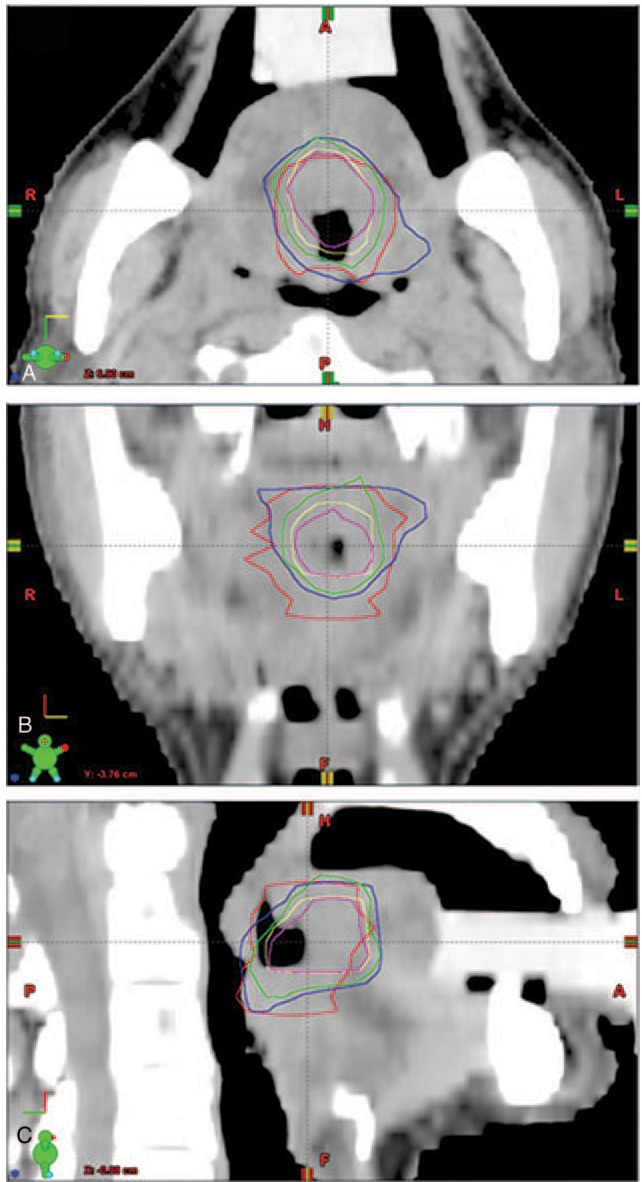
Figure 1.

Axial (A), coronal (B), and sagittal (C) views of a tumor. The gross tumor volume of the primary (GTVp) is shown by the red line. The MTV of the tumor was determined using thresholds at different cutoff values, MTV2.5 (blue), MTV3.0 (green), MTV40% (yellow), and MTV50% (pink).
