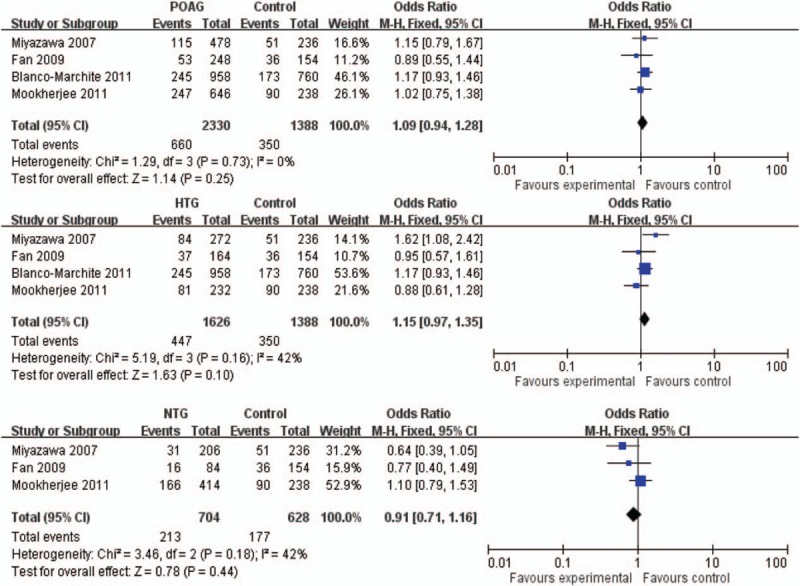
Figure 2.

Forest plot of rs11241095 (G) in POAG, HTG, and NTG in allelic model. The bars with squares in the middle represent 95% CIs and ORs, respectively. The size of the square is proportional to the weight of the study. A diamond indicates the summary OR with its corresponding 95% CI. The central vertical solid line indicates the ORs for the null hypothesis. CI = confidence interval, HTG = high tension glaucoma, NTG = normal tension glaucoma, OR = odds ratio, POAG = primary open angle glaucoma.
