Figure 1.

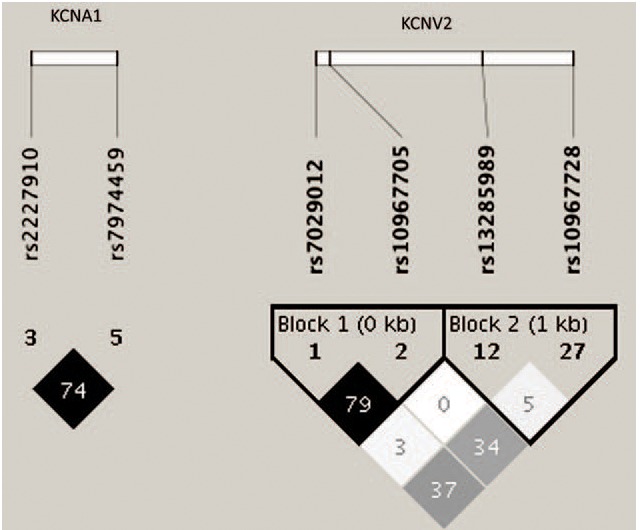
Linkage disequilibrium of tagSNPs with patients’ data. Linkage disequilibriums between pairs of polymorphisms are shown with diamonds (r2), with darker shading indicating greater r2.

Linkage disequilibrium of tagSNPs with patients’ data. Linkage disequilibriums between pairs of polymorphisms are shown with diamonds (r2), with darker shading indicating greater r2.