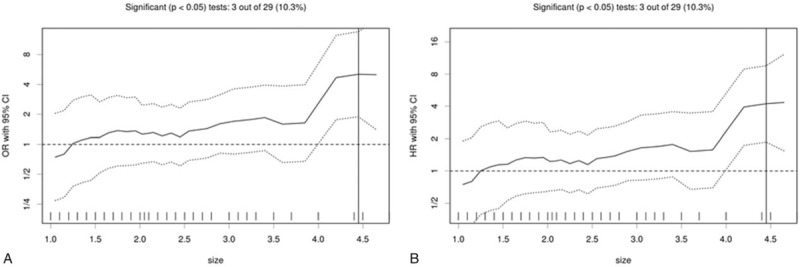
Figure 3.

Cutoff optimization by correlation with survival in the T1-2N0M0 breast cancer data. (A) The odds ratio including 95% confidence interval (CI) is plotted in dependence of the cutoff. A vertical line designates the dichotomization showing the most significant correlation with locoregional recurrence (LRR). (B) The hazard ratio including 95% CI is plotted in dependence of the cutoff. A vertical line designates the dichotomization showing the most significant correlation with LRR. The distribution of tumor size in the 353 tumors is shown as a rug plot at the bottom of the figures.
