Supplemental Digital Content is available in the text
Keywords: 16S, Crohn disease, inflammatory bowel disease, microbiome, pediatrics
Abstract
The human microbiome is of considerable interest to pediatric inflammatory bowel disease (PIBD) researchers with 1 potential mechanism for disease development being aberrant immune handling of the intestinal bacteria. This study analyses the fecal microbiome through treatment in newly diagnosed PIBD patients and compares to cohabiting siblings where possible. Patients were recruited on clinical suspicion of PIBD before diagnosis. Treatment-naïve fecal samples were collected, with further samples at 2 and 6 weeks into treatment. Samples underwent 16S ribosomal ribonucleic acid (RNA) gene sequencing and short-chain fatty acids (SCFAs) analysis, results were analyzed using quantitative-insights-into-microbial-ecology. Six PIBD patients were included in the cohort: 4 Crohn disease (CD), 1 ulcerative colitis (UC), 1 inflammatory bowel disease (IBD) unclassified, and median age 12.6 (range 10–15.1 years); 3 patients had an unaffected healthy sibling recruited. Microbial diversity (observed species/Chao1/Shannon diversity) was reduced in treatment-naïve patients compared to siblings and patients in remission. Principal coordinate analysis using Bray–Curtis dissimilarity and UniFrac revealed microbial shifts in CD over the treatment course. In treatment-naïve PIBD, there was reduction in functional ability for amino acid metabolism and carbohydrate handling compared to controls (P = .038) and patients in remission (P = .027). Metabolic function returned to normal after remission was achieved. SCFA revealed consistent detection of lactate in treatment-naïve samples. This study adds in-depth 16S rRNA sequencing analysis on a small longitudinal cohort to the literature and includes sibling controls and patients with UC/IBD unclassified. It highlights the initial dysbiosis, reduced diversity, altered functional potential, and subsequent shifts in bacteria from diagnosis over time to remission.
1. Introduction
PIBD, comprising Crohn disease (CD), ulcerative colitis (UC), and inflammatory bowel disease unclassified (IBDU), is a group of conditions leading to significant morbidity in children. An interaction between dysfunctional host immunity in the genetically susceptible individual and an environmental trigger appears to underlie disease pathogenesis.[1,2] Recent studies have shown an increasing incidence of PIBD within the United Kingdom but the reasons behind this remain unclear.[3,4]
The microbiome is of considerable interest to inflammatory bowel disease (IBD) researchers. The intestinal microbiome consists of luminal and mucosal communities[5]; a possible mechanism for disease development in PIBD is aberrant immune handling of the microbiome resulting in inflammation[6]; alternatively, a dysbiosis in the microbiota may trigger disease in immunologically normal individuals.[7] Several studies focussing on the treatment naïve (TN) pediatric CD patient have made observations of significant mucosal microbial dysbiosis compared to healthy controls,[8,9] and this dysbiosis has also been observed in historically diagnosed, active PIBD.[10,11] Some studies comparing the fecal and mucosal microbiome have demonstrated differences in the fecal organisms seen in PIBD cases and controls,[10–13] whilst others have shown little variation.[8] It is widely accepted that alterations in the mucosal microbiome are more pronounced than those observed in the fecal microbiome.[8,12]
Despite the intense interest in the role of the microbiome in PIBD, there have been few longitudinal studies.[14] Dysbiosis of the gut microbiota in pediatric CD patients treated with exclusive enteral nutrition (EEN) has been broadly demonstrated in patients using denaturing gradient gel electrophoresis[15] and more recently through next-generation sequencing, including metagenomic analysis.[14,16]
With the advent of high-throughput next-generation 16S rRNA gene sequencing, the microbiome can now be characterized in depth and detail that was not previously available.[8] This study analyses the fecal microbiome from prediagnosis to 6 weeks of treatment in newly diagnosed, TN pediatric IBD patients, and additionally compares individuals to cohabiting sibling controls where available.
2. Materials and methods
All patients were recruited following referral to Southampton Children's Hospital. The pediatric gastroenterology service at Southampton diagnoses approximately 60 to 70 new cases of PIBD every year. Diagnosis was based on the Porto criteria.[17]
Six PIBD patients were recruited, of whom 2 were male. Subsequent diagnosis indicated that 4 had CD, 1 UC, and 1 IBD unclassified (Table 1). The median age at diagnosis was 12.7 years. Patients with a suspected diagnosis of PIBD were recruited after the initial clinic visit, before investigation or treatment. Specific histological diagnosis was obtained within 2 weeks for all patients. Fecal samples were obtained before the commencement of treatment, and at 2 to 4 weeks and 6 to 8 weeks postdiagnostic endoscopy. Clinical data on disease activity, including fecal calprotectin, were collected prospectively at each visit.
Table 1.
Patient details: diagnosis, treatment, and disease course.

Single-control samples were obtained from siblings living within the same household at the time of their sibling's diagnosis.
2.1. Ethical approval
The study has ethical approval from Southampton & South West Hampshire Research Ethics Committee (09/H0504/125). This study was conducted in accordance with relevant guidelines, all protocols were approved by the ethics committee above and informed consent was obtained from all subjects.
2.2. Sample collection
Samples were collected using a commode specimen collection kit (Ardinal). All samples were processed within 24 hours. Before processing and during transit all samples were in sealed containers with some air and kept on ice in an insulated cool-bag at a temperature estimated to be less than 8 °C.
2.3. Sample processing
Samples were homogenized. Two grams of feces was immediately frozen at −80 °C for short-chain fatty acid (SCFA) analysis. Five grams of feces was separated for further processing. A unit of 10 mL of phosphate buffered saline/30% glycerol solution was added and samples were further homogenized using sterile glass beads and vortex, these samples were then frozen immediately at −80 °C in 450-μL aliquots.
2.4. DNA extraction and 16S rRNA gene sequencing
Deoxyribonucleic acid (DNA) was extracted using MP Biomedical (Santa Ana, California) Feces Extraction kit following the manufacturer's instructions. An amount of 20 ng of extracted DNA underwent processing at Source Bioscience (Nottingham, UK). The V4 area was targeted by amplification using the degenerate primers (forward TATGGTAATTGTGTGCCAGCMGCCGCGGTAA, reverse AGTCAGTCAGCCGGACTACHVGGGTWTCTAAT). polymerase chain reaction (PCR) products were between 300 and 350 bp in length with an individual sample barcode incorporated into the reverse primer. PCR fragments were then sequenced on an Illumina MiSeq with 2 150-bp paired-end reads. Steps in sequencing were as follows: 1st stage PCR, PCR clean-up, 2nd stage PCR, PCR clean-up 2, library quantification and normalization, library denaturing, and MiSeq sample loading at 10 pM.
2.5. Bioinformatics—microbiome analysis
16S rRNA gene sequencing data were processed using the quantitative insights into microbial ecology (QIIME) analysis pipeline. Bacterial community composition of a sample is achieved by clustering reads into operational taxonomic units and assigning taxonomy using the Greengenes (gg_13_8) database of 16S rRNA sequences.[18] Clustering was performed using a 97% similarity index, thereby allowing identification of some bacteria to the species level. Further analysis of alpha and beta diversity was performed using QIIME.
2.6. Functional analysis
Metagenomic inference and functional analysis was performed using phylogenetic investigation of communities by reconstruction of unobserved states (PICRUSt).[19] PICRUSt utilizes a computational approach and predicts a metagenome using 16S data, from this it predicts which genes are present and thus predicts functional composition of the metagenome. Pathway analysis was conducted using Kyoto Encyclopaedia of Genes and Genomes (KEGG) pathways.[20]
Output data from PICRUSt were filtered for metabolic pathways as these are assumed to be the most relevant for IBD.[8] Median gene counts from patients at each time point (TN, control, and remission) were compared. Differences were calculated between time points for each metabolic pathway to estimate functional differences in the microbiome.
2.7. Fecal calprotectin measurements
Estimation of Calprotectin concentrations were carried out using the CALPROLAB Calprotectin enzyme-linked immunosorbent assay (ELISA) (ALP) kit (Lysaker, Norway) and Calpro Fecal Extraction Device (Lysaker, Norway). A unit of 100 mg of homogenized feces was dispersed in 4.9 mL of extraction buffer by vortexing for 3 minutes. The fecal extract and standards were assayed by sandwich ELISA following the manufacturer's instructions. Sample values were calculated by comparison with standard curve plots prepared using the calprotectin standards provided in the kit.
2.8. SCFA analysis
Aliquots of homogenized fecal samples (∼1 g) were mixed with sterile H2O (1:3 w/v), vortexed for 2 minutes, centrifuged for 10 minutes at 1000 × g, and the supernatant collected and frozen. Fecal acetate, propionate, butyrate, lactate, and total SCFAs were subsequently quantified in duplicate using capillary gas chromatography with 0.1 mol/L 2-ethyl butyric acid as an internal standard, as described previously.[21]
2.9. Statistics
Statistical analysis was with Shapiro–Wilk normality test (in order to test the distribution of data), Student t test (alpha diversity), and Mann–Whitney U test (comparison of groups in functional analysis) and was performed using SPSS v22 (IBM, North Castle, NY).
3. Results
Six PIBD patients were recruited; 4 CD, 1 UC, and 1 IBD unclassified (Table 1). Two were male. Median age at diagnosis was 12.7 years. All patients were diagnosed according to the modified Porto criteria.[17] Three of these patients had a healthy sibling control recruited simultaneously (fecal calprotectin values were 120, 32, and 24 mg/kg for sibling controls of patients 1–3, respectively). All recruited siblings were reported to be well at the time of investigation and have not developed PIBD subsequently. All patients provided fecal samples before commencement of bowel preparation for diagnostic endoscopy and further fecal samples at 2 weeks (median 14 days, range 12–25 days) and 6 weeks (median 41 days, range 36–49 days) after commencement of treatment. These 21 samples were characterized for microbiome composition, fecal calprotectin, and SCFA concentrations (18 IBD, 3 sibling controls).
3.1. Disease activity and treatment
Disease activity and remission was assessed by physician assessment and subsequently in conjunction with fecal calprotectin levels (Fig. 1). Fecal calprotectin is a marker protein for colonic inflammation which can be stably detected in feces.
Figure 1.
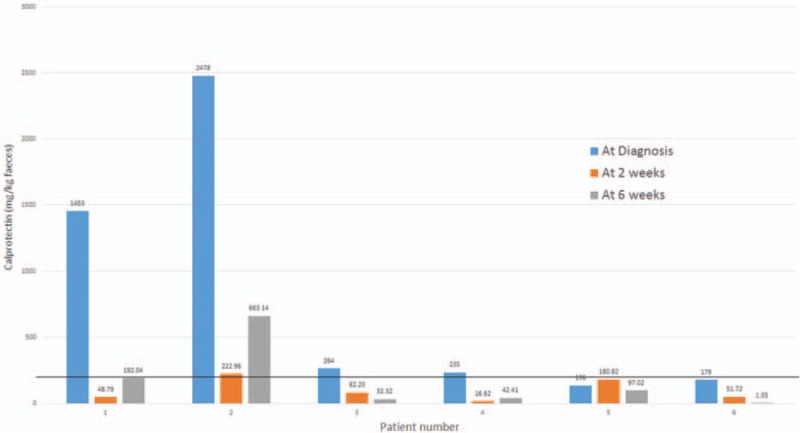
Changes in fecal calprotectin across time. Solid line demonstrates the threshold for active intestinal inflammation (>200 mg/kg), with the normal range 5 to 50 mg/kg. Patient numbers correspond to those described in Table 1.
Patients were treated with either EEN (Modulen; Nestle, Switzerland) or corticosteroid therapy, depending on disease type and site, in accordance with national guidelines.[22,23] In all cases, treatment was started within 24 hours of diagnosis (based on endoscopy findings).
3.2. Microbial composition analysis
A heatmap of common genera produced by Bray–Curtis dissimilarity (see below) can be seen in Fig. 2. This details the most common species seen across all samples and the relationship between samples and bacteria.
Figure 2.
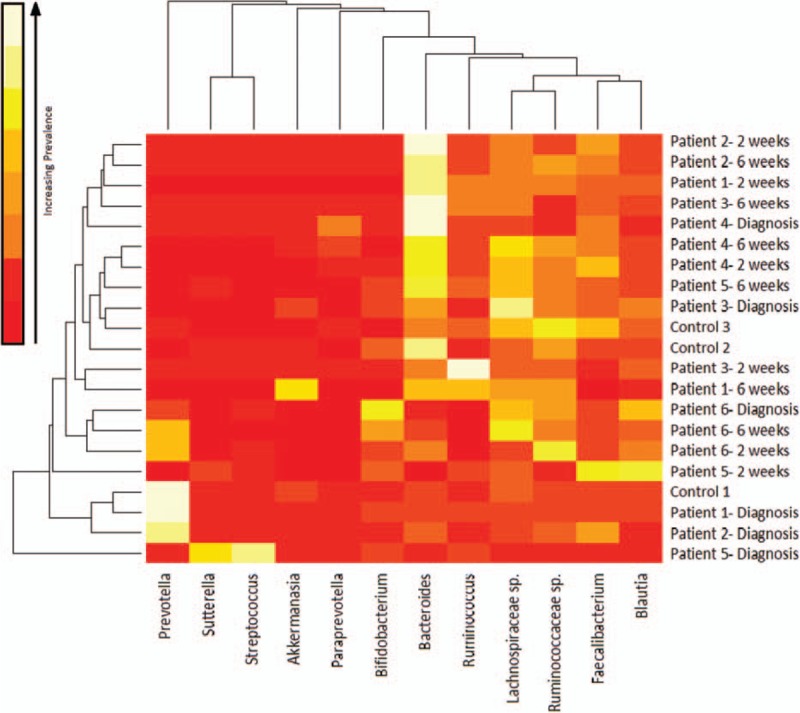
Heatmap of common genera in all samples across treatment produced using Bray–Curtis dissimilarity—lighter colors indicates more abundance of that genera (white is most abundant). The degree of similarity of microbiota can be observed using the dendrogram on the x-axis. The degree of similarity of sample can be observed using the dendrogram on the y-axis.
There was significant variation between all samples with significant intraindividual variation. Several patients had distinct microbiota at diagnosis. For example, patient 1 and their sibling control had large numbers of Prevotella species (66% and 60%, respectively). These siblings are of Nigerian ethnicity but were born in the United Kingdom, and these bacteria are known to be associated with a high-fiber “rural African diet.”[24] With EEN, this genus rapidly decreased over 2 weeks to below 0.0006%. Patient 2 (white British) had 35% Prevotella at diagnosis, again declining with EEN treatment. No other patient had greater than 13.5% prevalence of Prevotella at diagnosis. Patient 5's (UC) treatment-naive sample was also distinctive with a high proportion of Streptococcus (and Proteobacteria) in comparison to the other patients; at a genus level, this patient had 37% Streptococcus and 18% Sutturella.
After remission was reached (at 2–6 weeks, see Table 1), the most commonly occurring bacteria were generally altered. There were increased numbers of Bacteroides in all patients, Clostridium classes were still prevalent but included a greater diversity of species. There was also an expansion of Bifidobacterium in 3 patients.
3.3. Alpha diversity
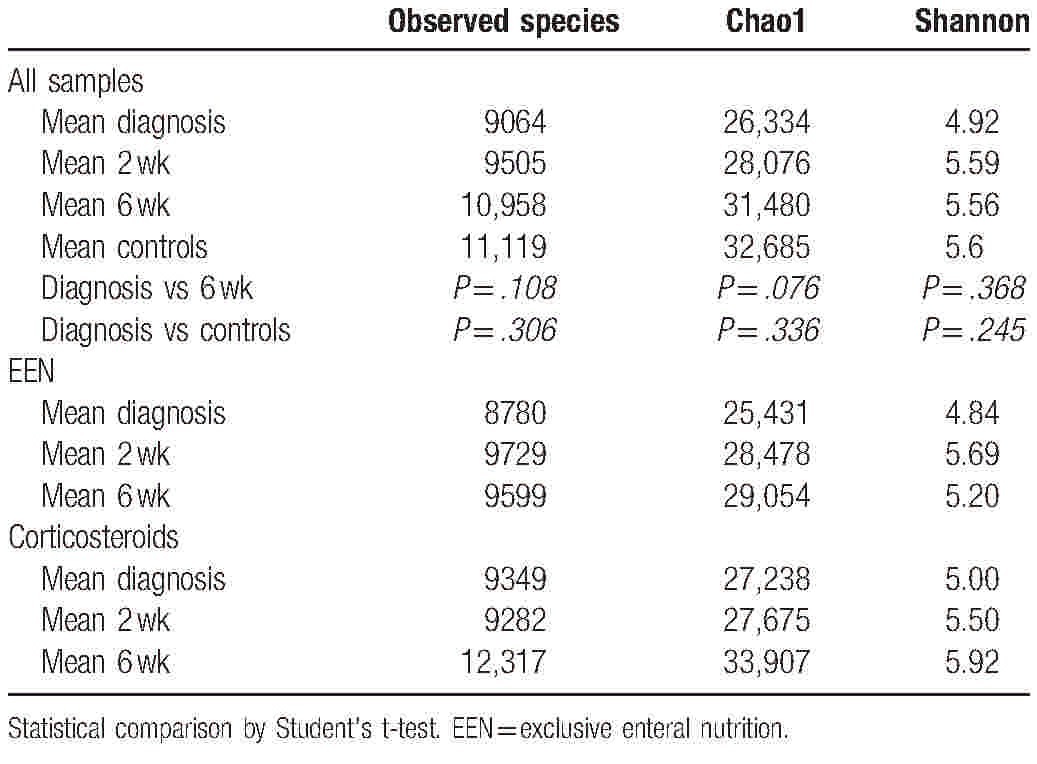
Three measures were used to analyze species diversity within samples. Data were normally distributed. The mean results can be seen in Table 2. All 3 measures (observed species, chao1, and Shannon diversity) show an increase in diversity from diagnosis throughout treatment, although none reach statistical significance (Table 2). Controls have increased alpha diversity compared to patients at any time point, but this is not statistically significant. Samples at 6 weeks postdiagnosis, when all patients were in clinical remission, have the most similar diversity metrics to controls.
Table 2.
Mean alpha diversity measures for PIBD patients and controls through treatment and by treatment type—increasing diversity through treatment.
3.4. Individuals during treatment
Alpha diversity for all PIBD patients across the 3 time points can be seen in Fig. 3A to C. There is significant variation within the mean values with a tendency toward increased diversity across treatment.
Figure 3.
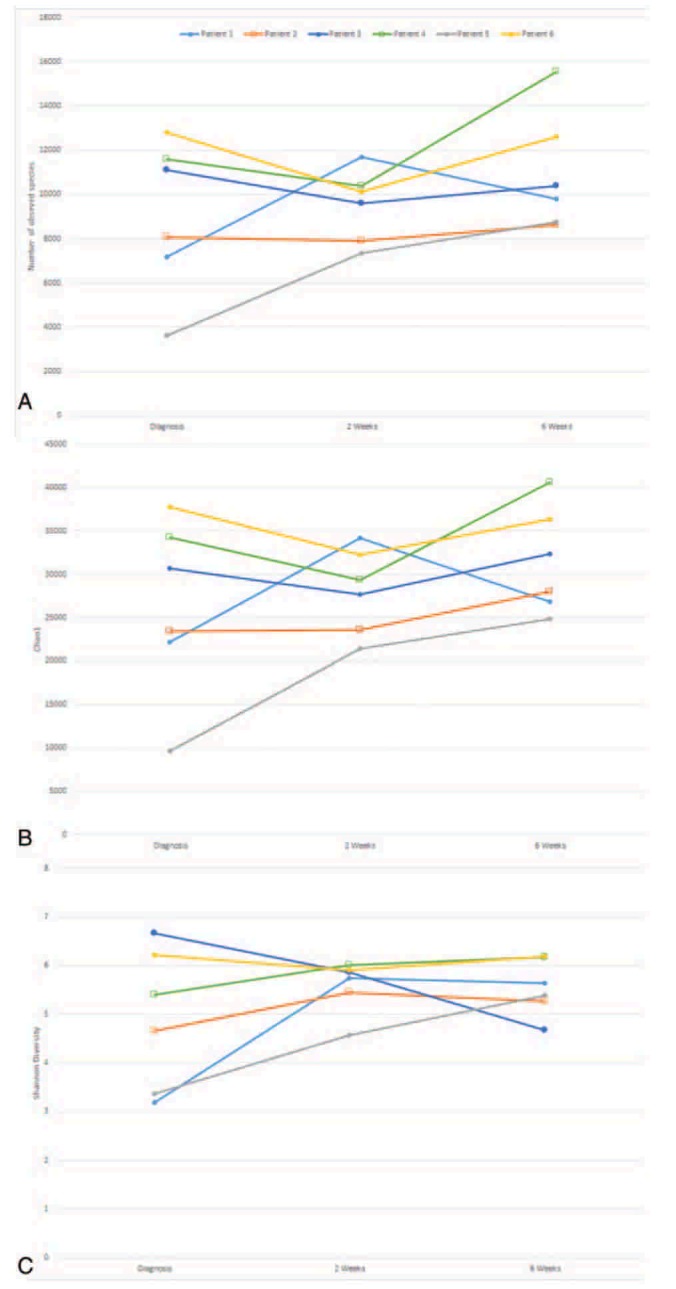
(A) Observed species for individual patients across treatment, (B) Chao1 diversity for individual patients across treatment, (C) Shannon diversity for individual patients across treatment. (○ Indicates patients who went into remission at 2 weeks, □ indicates patients who went into remission at 6 weeks).
3.5. Treatment type
Results were collated by treatment type. Increases in diversity from diagnosis to remission were observed for those treated with both EEN and steroid therapy (Table 2).
3.6. Antibiotics
There were 3 patients who had been treated with antibiotics in the 6 weeks before initial sample (2 with metronidazole, 1 with amoxicillin). These were patients 2, 4, and 5. Comparing alpha diversity measures at diagnosis between these patients and those not treated with antibiotics showed decreases in the average number of observed species (antibiotics 9096 vs no antibiotics 10,333), Chao1 (26,110 vs 31,150), and Shannon diversity (5.15 vs 5.57).
3.7. Compositional changes in microbiota
Principal coordinate analysis (PCoA) was undertaken for all samples following analysis through application of Bray–Curtis dissimilarity (Fig. 4A, BC, compositional dissimilarity between samples), unweighted UniFrac (Fig. 4B, UU, diversity between samples incorporating relative relatedness) and weighted UniFrac (Fig. 4C, WU, diversity between samples incorporating relative relatedness and relative abundance).
Figure 4.
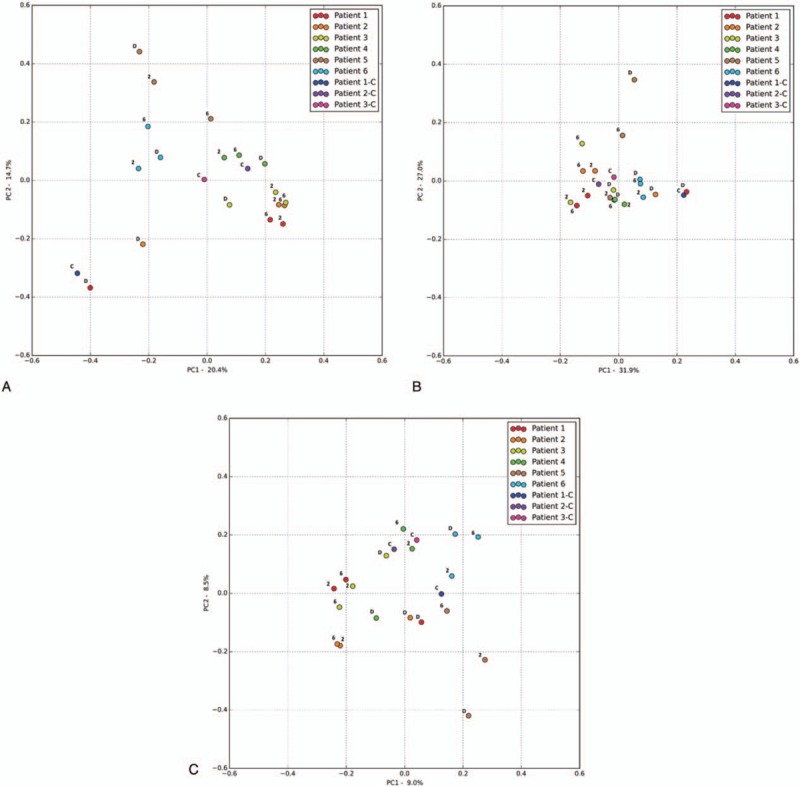
(A) Principal coordinate analysis (PCoA) Bray–Curtis dissimilarity PC1 vs PC2, D = before diagnosis, 2 = 2 weeks into treatment, 6 = 6 weeks into treatment, C = control. For patients details please see Table 1. (B) PCoA weighted UniFrac PC1 vs PC2, D = before diagnosis, 2 = 2 weeks into treatment, 6 = 6 weeks into treatment, C = control. For patients details please refer to Table 1. (C) PCoA unweighted UniFrac PC1 vs PC2, D = before diagnosis, 2 = 2 weeks into treatment, 6 = 6 weeks into treatment, C = control. For patients details please refer to Table 1.
Both Bray–Curtis and UniFrac PCoA revealed high similarity between patient 1 (at diagnosis) and their sibling control, and patient 3 (at diagnosis) and their sibling control.
Patients with CD or UC showed a distinct shift on PCoA (BC, UU, and WU) from diagnosis to treatment. The single patient with IBDU (patient 6) did not show any discernible shift with all 3 time points clustering on PCoA (Fig. 4A).
3.8. Metagenomic and functional analysis
Output data from QIIME was analyzed using PICRUSt enabling the metagenomic make-up of samples to be inferred from the 16S data. A total of 147 metabolic pathways were identified by PICRUSt (see Supplementary Table 1). Subsequent analysis looked at the functional impact of microbial shifts. Comparison of TN patients at diagnosis with control samples and with samples from the patients in remission showed significantly different metabolic function across the 147 KEGG pathways identified, as assessed by gene copy number (P = .038 and .027 respectively) (Fig. 5). Patients in remission and controls showed no differences in metabolic function as assessed by gene copy number across the 147 KEGG pathways (P = .86). There were large differences (predicted functional reduction >30%) in 31 pathways between TN patients and both controls and patients in remission. An additional 36 pathways displayed a predicted functional reduction of between 10 and 30%. Specifically there were large reductions in amino acid synthesis and metabolism pathways (particularly in those associated with arginine, proline, lysine, valine, leucine, and isoleucine) and in carbohydrate handling, particularly in pathways associated with fructose, mannose, galactose, starch, and sucrose metabolism. There was also a predicted reduction in nucleotide (purine and pyrimidine) metabolism and decreased nitrogen metabolism in treatment naive patients.
Figure 5.
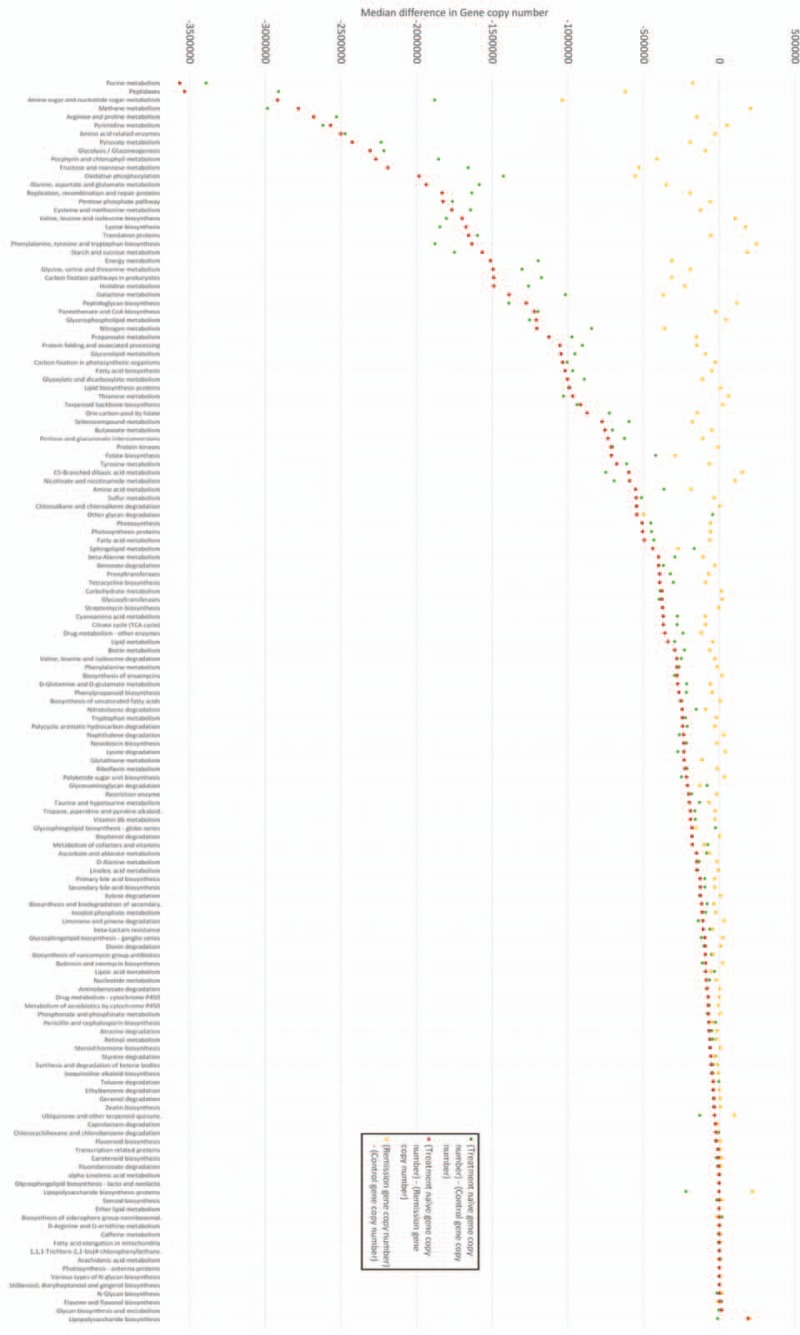
Comparison of 147 common metabolic pathways in IBD fecal microbiome samples-markers indicate absolute difference in predicted function (gene copy number) between samples, a value of 0 indicates no difference in predicted function (gene copy number). Negative difference in gene copy numbers indicate loss of function in treatment-naïve (TN) patients in that metabolic pathway. Differences are calculated by subtracting the predicted gene copy number in 1 group from another (refer to this figure). For example, the metabolic pathway associated with purine metabolism (first pathway on x-axis) displayed the greatest loss of function in TN samples compared to both control samples and samples from patients in remission. There was a median reduction of −3391,471 (TN—control) and −356,6025 (TN—remission) gene copies between samples indicating significantly reduced functional capability in this metabolic pathway in patients with TN IBD. Controls and patients in remission were not statistically different (P = .86). There are statistically significant differences in function (gene copy number) between both TN and controls (P = .038), and TN and patients in remission (P = .027) across all 147 Kyoto Encyclopaedia of Genes and Genomes (KEGG) pathways. Statistical analysis was with Shapiro–Wilk normality test (distribution of data) and Mann–Whitney U test (functional analysis). Please refer to Supplementary table 1 for clarification of KEGG pathways and exact gene copy number differences. IBD = inflammatory bowel disease.
3.9. Short chain fatty acid analysis
The fecal samples were analyzed for SCFA content (patient 5's 6-week sample was unsuccessful) (Fig. 6). In all samples the predominant SCFAs were acetate, propionate and butyrate, in that order of abundance. Over treatment, there were no dramatic shifts in relative concentrations of SCFA, and no consistent effects of either EEN or steroid treatment. Levels of succinate increased in patients 2 and 3 when remission was reached. Lactate was detected in all the samples (median concentration = 2.45 mmol/L), while it is often undetectable in studies of healthy individuals. In patient 5, there was a comparatively large amount of lactate before diagnosis (29.3 mmol) which disappeared after 2 weeks of treatment. Patient 1 also had high lactate (15.3 mmol) concentrations at diagnosis which again decreased during treatment, this time with an associated rise in butyrate concentrations.
Figure 6.
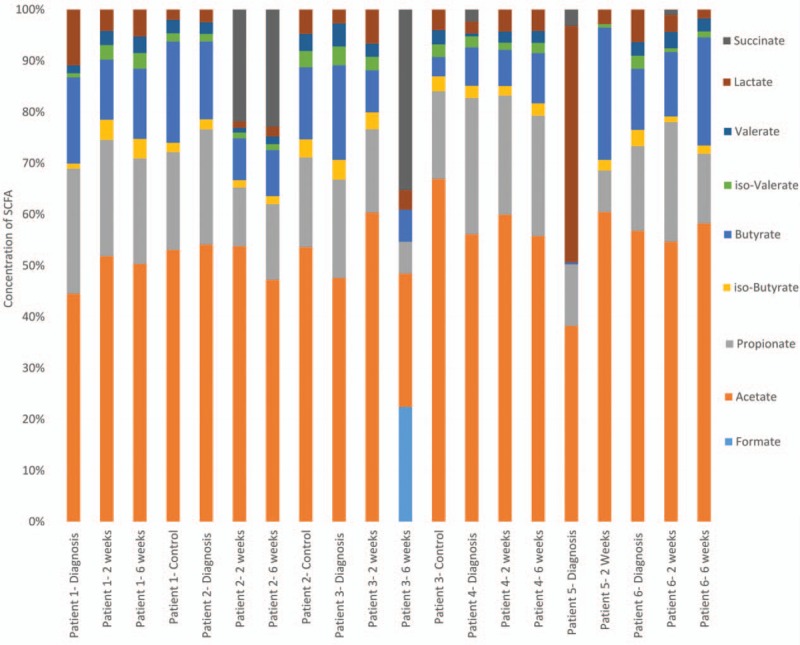
Fecal short-chain fatty acid relative concentration over time in pediatric inflammatory bowel disease patients and controls—for absolute abundance refer to Supplementary table 2.
3.10. SCFA and functional analysis
Of the 147 metabolic pathways identified, those implicated in SCFA were examined. Two pathways (Butyrate metabolism and Propionate metabolism) were seen to be reduced in TN patients compared to controls. The relative abundance of these SCFA was observed; there were no statistically significant differences between TN patients and controls/patients in remission. Propionate relative abundance was slightly decreased (TN 20.4% vs control/remission 18.1%), Butyrate was slightly increased (TN 11.8% vs control/remission 13.6%) and isobutyrate was also slightly increased (TN 2.1% vs control/remission 2.3%) (Fig. 6).
4. Discussion
This study details sequential analysis of the fecal microbiome of 6 PIBD (including CD, UC, and IBDU) patients treated with standard therapies over a 6-week period. Our study provides in-depth analysis of the fecal microbiome in newly diagnosed TN PIBD patients and follows these through to remission. These results, including clear microbial shifts and detailed functional analysis, suggest similar examination of larger numbers of patients could give insight into the etiology of IBD. The utilization of sibling controls is novel, and it was hoped this would reduce the natural variation seen in the fecal microbiome caused by diet and environment.[25] The value of this is apparent with the very high incidence of Prevotella observed in both patient 1 and their sibling control. Overall, the data generated in this study are valuable but further patient numbers are required to produce firm conclusions.
Previous studies have demonstrated a reduction in bacterial diversity in TN children with CD.[14–16] We have shown similar profiles for all PIBD patients, there was reduced alpha diversity (consistently observed by 3 measures-observed species, Chao1, and Shannon index) in treatment naive patients compared to the same patients when remission was achieved. Both patient treatment groups, EEN and corticosteroids, had an increase in diversity for all measures (other than Shannon index in those treated with corticosteroids) during the treatment course.
Beta diversity was assessed through Bray–Curtis dissimilarity index and through weighted and unweighted UniFrac analysis. For all patients, other than patient 5 (UC), there are clear shifts on all analyses from before diagnosis to after treatment. Generally there was clustering of patients 1, 2, 3, and 4 (all CD) after treatment (samples at 2 and 6 weeks) for both Bray–Curtis and UniFrac PCoA, although this was not ubiquitous for all principal coordinates. Patient 5 (UC) showed similar shifts in PCoA analysis to the patients with CD, whereas there were no shifts for patient 6 (IBDU) with clustering of samples from all 3 time periods in all analyses. Interestingly, controls were generally closely related to their affected sibling; with the closest clustering occurring between PIBD samples before diagnosis and their sibling control. This was especially evident for patients 1 and 3 who were closely related on both Bray–Curtis and unweighted UniFrac PCoA.
The predicted metabolic function of the microbiome was assessed. Despite low patient numbers, it appears that there is a clear difference in functional capability between the microbiome in TN patients and the same patients after they have gone into remission. Patients in remission resemble controls in terms of functional profile. Previous metagenomic analysis has characterized the functional changes of mucosal microbiome samples in CD, displaying clear evidence that there is reduced amino acid biosynthesis and carbohydrate metabolism.[12]
This study has, for the first time, compared the functional ability of the microbiome before treatment to the functional ability in the same patients once they have achieved remission through inference of the metagenome by PICRUSt. Genes involved in both amino acid biosynthesis and metabolism, and carbohydrate metabolism (specifically starch, sucrose, fructose, and mannose metabolism) were less abundant in the pretreatment samples when the disease was active than in the later samples taken during remission. Interestingly, the functional ability of the microbiome returns to a state very similar to that of controls when remission is achieved. Where there is significant inter and intrapatient heterogeneity in the bacterial species present in IBD before and after treatment, these results indicate that there is relative functional homogeneity.
This study also looked at SCFA concentrations in feces over time. Previous work has suggested a role for specific SCFA as anti-inflammatory agents within the bowel.[26,27] The most common metabolic products of anaerobic bacteria are acetate, propionate and butyrate and these have been suggested to impact on the interaction that the immune system has with bacteria producing these SCFAs, with the overall effect of reducing inflammation through reduction of chemokine production and adhesion molecule expression.[27] The predominant SCFAs in our samples were acetate, propionate and butyrate, including in controls. The relative concentrations of these SCFA over time did not show a consistent pattern with some patients seeing increases and some seeing decreases in both overall and relative concentrations. High concentrations of lactate, which has been implicated in UC were observed in the pretreatment samples for this patient only.[28] It is worth noting that SCFA detection in fecal samples is affected by both production and absorption of SCFAs in the large intestine. During disease remission the intestinal epithelial surface is less inflamed and may absorb more SCFA, so the absence of detectable changes in concentrations may not necessarily mean that bacterial fermentation has not changed.
The microbiome has previously been assessed in large cohorts of TN CD patients.[8,11] These have concluded that there is significant dysbiosis in ileal and rectal mucosal biopsy samples which is more weakly reflected in the fecal microbiome.[8,12] The same studies have also described shifts in the predominant bacterial species in diseased patients, with a general change to aerobic species in the feces as inflammation increases.[29] Our results indicate a similar shift with an increase in the anaerobic Clostridia and Bacteroides species from diagnosis to remission. It should be noted that the microbiota of fecal samples may be influenced by bowel preparation medication up to 2 to 4 weeks after administration.
Some studies have followed children with CD from diagnosis through treatment with EEN.[14,16,30] Most of these studies have reported a decrease in diversity during treatment with EEN; our results demonstrate a different pattern over the period of EEN, with an increase in diversity, peaking at 2 weeks. Interestingly, children treated with steroids also showed increased diversity from treatment to remission, with a peak in diversity at 6 weeks. The reasons behind this are unclear. There were 3 patients treated with antibiotics in the 2 months before recruitment (patients 2, 4, and 5); antibiotics are known have a significant impact on intestinal bacteria and may amplify intestinal dysbiosis in some cases.[8,31]
The strengths of this study lie in the robust and consistent data and sample collection by a single center, and the linked assessment of both microbial composition and activity. The main limitation is the small patient number and heterogeneity of the population. Despite this, we present detailed analysis of 16S rRNA sequencing data to a level not previously described in patients followed across time during treatment. There is little published data on the microbiome in Ulcerative Colitis or IBDU, Gevers et al[8] included a small number of UC patients in their extended PCoA analysis in 2014 without obvious trends. Here we demonstrate a single patient with IBDU over time, whose microbiome appears to behave differently to patients with CD and UC in this study. The PCoA shift for the patient with UC resembles CD; whilst a previous study indicated substantial dysbiosis in fecal samples from children with severe colitis there have been no longitudinal studies of UC to date.[10]
5. Conclusion
These data add in-depth 16S rRNA gene sequencing analysis on a longitudinal PIBD cohort, including patients with UC/IBDU to the literature. The inclusion of sibling controls helps to address differences that may be diet related. It highlights the initial dysbiosis, reduced diversity with dominance of single bacterial genera, and subsequent shifts in bacteria from before diagnosis over time to remission. Further characterization of the SCFA composition of feces would aid understanding of the roles SCFA may play in intestinal inflammation and microbe–host interaction. The functional ability of bacteria at presentation is significantly reduced in several key pathways; however, this returns to normal when remission is achieved, echoing previous findings targeting the mucosal microbiota. Further longitudinal studies on larger pediatric cohorts is required within this area.
Supplementary Material
Footnotes
Abbreviations: CD = Crohn disease, IBDU = inflammatory bowel disease unclassified, PIBD = pediatric inflammatory bowel disease, PiCRUSt = phylogenetic investigation of communities by reconstruction of unobserved states, QIIME = quantitative-insights-into-microbial-ecology, SCFA = short-chain fatty acid, UC = ulcerative colitis.
JJA and CMC denotes joint first author. RMB, KPS, and SE denotes joint final author. The open access costs of this manuscript were funded through a grant from Health Education England (Wessex).
Contributorship: SE, RMB, JJA, and KPS conceived the study. Patients were recruited by JJA, TC, and RH. Data were gathered by CMC and KPS. Data were analyzed by JJA and DWC with input from CMC and KPS. The manuscript was written by JJA with assistance from all authors. All authors approved the manuscript before submission. At the time of this research being conducted I Mulder was not associated with 4D Pharma. At the point of manuscript preparation she was employed in this role.
Funding/support: JJA is funded by a National Institute of Health Research Academic Clinical Fellowship and has received an Action Medical Research training fellowship. TC is funded by a Crohn in Childhood research association fellowship. CMC received a PhD studentship from SULSA Spirit industrial studentship. The NGS analysis was made possible by the award of a grant from the Source Bioscience 110th year anniversary promotion to CMC. The Rowett Institute receives funding from the Scottish Government (RESAS).
The authors have no conflicts of interest to disclose.
Supplemental Digital Content is available for this article.
References
- [1].Henderson P, van Limbergen JE, Wilson DC, et al. Genetics of childhood-onset inflammatory bowel disease. Inflamm Bowel Dis 2011;17:346–61. [DOI] [PubMed] [Google Scholar]
- [2].Kaser A, Zeissig S, Blumberg RS. Inflammatory bowel disease. Annu Rev Immunol 2010;28:573–621. [DOI] [PMC free article] [PubMed] [Google Scholar]
- [3].Ashton JJ, Wiskin AE, Ennis S, et al. Rising incidence of paediatric inflammatory bowel disease (PIBD) in Wessex, Southern England. Arch Dis Child 2014;99:659–64. [DOI] [PubMed] [Google Scholar]
- [4].Henderson P, Hansen R, Cameron FL, et al. Rising incidence of pediatric inflammatory bowel disease in Scotland. Inflamm Bowel Dis 2012;18:999–1005. [DOI] [PubMed] [Google Scholar]
- [5].Turnbaugh PJ, Ley RE, Hamady M, et al. The human microbiome project. Nature 2007;449:804–10. [DOI] [PMC free article] [PubMed] [Google Scholar]
- [6].Hisamatsu T, Kanai T, Mikami Y, et al. Immune aspects of the pathogenesis of inflammatory bowel disease. Pharmacol Ther 2013;137:283–97. [DOI] [PubMed] [Google Scholar]
- [7].Khor B, Gardet A, Xavier RJ. Genetics and pathogenesis of inflammatory bowel disease. Nature 2011;474:307–17. [DOI] [PMC free article] [PubMed] [Google Scholar]
- [8].Gevers D, Kugathasan S, Denson LA, et al. The treatment-naive microbiome in new-onset Crohn's disease. Cell Host Microbe 2014;15:382–92. [DOI] [PMC free article] [PubMed] [Google Scholar]
- [9].Haberman Y, Tickle TL, Dexheimer PJ, et al. Pediatric Crohn disease patients exhibit specific ileal transcriptome and microbiome signature. J Clin Invest 2015;125:1363. [DOI] [PMC free article] [PubMed] [Google Scholar]
- [10].Michail S, Durbin M, Turner D, et al. Alterations in the gut microbiome of children with severe ulcerative colitis. Inflamm Bowel Dis 2012;18:1799–808. [DOI] [PMC free article] [PubMed] [Google Scholar]
- [11].Papa E, Docktor M, Smillie C, et al. Non-invasive mapping of the gastrointestinal microbiota identifies children with inflammatory bowel disease. PLoS One 2012;7:e39242. [DOI] [PMC free article] [PubMed] [Google Scholar]
- [12].Morgan XC, Tickle TL, Sokol H, et al. Dysfunction of the intestinal microbiome in inflammatory bowel disease and treatment. Genome Biol 2012;13:R79. [DOI] [PMC free article] [PubMed] [Google Scholar]
- [13].Tjellstrom B, Hogberg L, Stenhammar L, et al. Effect of exclusive enteral nutrition on gut microflora function in children with Crohn's disease. Scand J Gastroenterol 2012;47:1454–9. [DOI] [PubMed] [Google Scholar]
- [14].Quince C, Ijaz UZ, Loman N, et al. Extensive modulation of the fecal metagenome in children with Crohn's disease during exclusive enteral nutrition. Am J Gastroenterol 2015;110:1718–29. [DOI] [PMC free article] [PubMed] [Google Scholar]
- [15].Leach ST, Mitchell HM, Eng WR, et al. Sustained modulation of intestinal bacteria by exclusive enteral nutrition used to treat children with Crohn's disease. Aliment Pharmacol Ther 2008;28:724–33. [DOI] [PubMed] [Google Scholar]
- [16].Kaakoush NO, Day AS, Leach ST, et al. Effect of exclusive enteral nutrition on the microbiota of children with newly diagnosed Crohn's disease. Clin Transl Gastroenterol 2015;6:e71–9. [DOI] [PMC free article] [PubMed] [Google Scholar]
- [17].Levine A, Koletzko S, Turner D, et al. ESPGHAN revised Porto criteria for the diagnosis of inflammatory bowel disease in children and adolescents. J Pediatr Gastroenterol Nutr 2014;58:795–806. [DOI] [PubMed] [Google Scholar]
- [18].http://greengenes.secondgenome.com/downloads/database/13_5. Greengenes 16S rRNA gene database and tools 2015. [Last accessed 13 December 2016]. [Google Scholar]
- [19].Langille MG, Zaneveld J, Caporaso JG, et al. Predictive functional profiling of microbial communities using 16S rRNA marker gene sequences. Nat Biotechnol 2013;31:814–21. [DOI] [PMC free article] [PubMed] [Google Scholar]
- [20].Kanehisa M, Goto M. KEGG: Kyoto encyclopedia of genes and genomes. Nucl Acid Res 2000;28:27–30. [DOI] [PMC free article] [PubMed] [Google Scholar]
- [21].Richardson AJ, Calder AG, Stewart CS, et al. Simultaneous determination of volatile and non-volatile acidic fermentation products of anaerobes by capillary gas chromatography. Lett Appl Microbiol 2008;9:5–8. [Google Scholar]
- [22].Turner D, Levine A, Escher JC, et al. Management of pediatric ulcerative colitis: joint ECCO and ESPGHAN evidence-based consensus guidelines. J Pediatr Gastroenterol Nutr 2012;55:340–61. [DOI] [PubMed] [Google Scholar]
- [23].Ruemmele FM, Veres G, Kolho KL, et al. Consensus guidelines of ECCO/ESPGHAN on the medical management of pediatric Crohn's disease. J Crohns Colitis 2014;8:1179–207. [DOI] [PubMed] [Google Scholar]
- [24].De Filippo C, Cavalieri D, Di Paola M, et al. Impact of diet in shaping gut microbiota revealed by a comparative study in children from Europe and rural Africa. Proc Natl Acad Sci U S A 2010;107:14691–6. [DOI] [PMC free article] [PubMed] [Google Scholar]
- [25].David LA, Maurice CF, Carmody RN, et al. Diet rapidly and reproducibly alters the human gut microbiome. Nature 2014;505:559–63. [DOI] [PMC free article] [PubMed] [Google Scholar]
- [26].Tedelind S, Westberg F, Kjerrulf M, et al. Anti-inflammatory properties of the short-chain fatty acids acetate and propionate: a study with relevance to inflammatory bowel disease. World J Gastroenterol 2007;13:2826–32. [DOI] [PMC free article] [PubMed] [Google Scholar]
- [27].Vinolo MA, Rodrigues HG, Nachbar RT, et al. Regulation of inflammation by short chain fatty acids. Nutrients 2011;3:858–76. [DOI] [PMC free article] [PubMed] [Google Scholar]
- [28].Hove H, Holtug K, Jeppesen PB, et al. Butyrate absorption and lactate secretion in ulcerative colitis. Dis Colon Rectum 1995;38:519–25. [DOI] [PubMed] [Google Scholar]
- [29].Mimouna S, Gonçalvès D, Barnich N, et al. Crohn disease-associated Escherichia coli promote gastrointestinal inflammatory disorders by activation of HIF-dependent responses. Gut Microbes 2011;2:335–46. [DOI] [PubMed] [Google Scholar]
- [30].Gerasimidis K, Bertz M, Hanske L, et al. Decline in presumptively protective gut bacterial species and metabolites are paradoxically associated with disease improvement in pediatric Crohn's disease during enteral nutrition. Inflamm Bowel Dis 2014;20:861–71. [DOI] [PubMed] [Google Scholar]
- [31].Jernberg C, Löfmark S, Edlund C, et al. Long-term impacts of antibiotic exposure on the human intestinal microbiota. Microbiology 2010;156:3216–23. [DOI] [PubMed] [Google Scholar]
Associated Data
This section collects any data citations, data availability statements, or supplementary materials included in this article.


