
Figure 5.
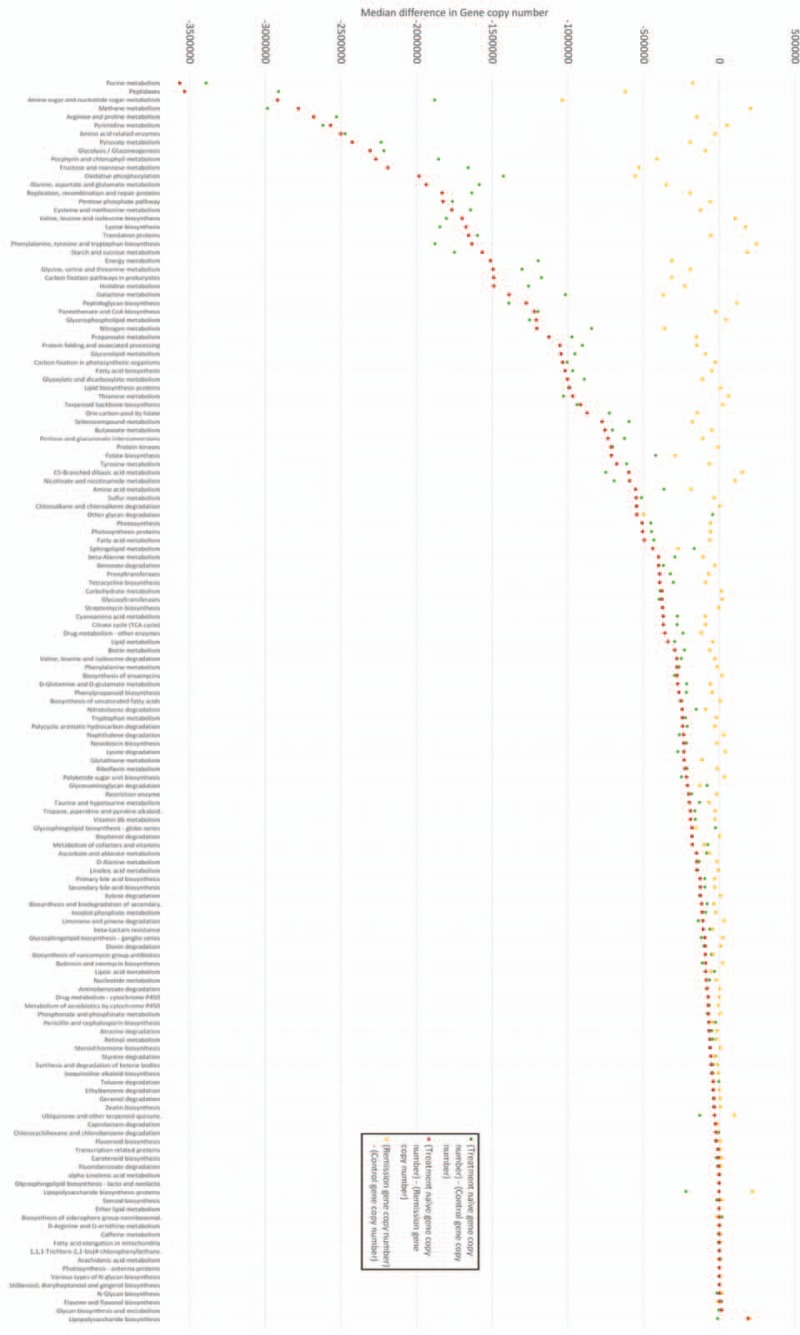
Comparison of 147 common metabolic pathways in IBD fecal microbiome samples-markers indicate absolute difference in predicted function (gene copy number) between samples, a value of 0 indicates no difference in predicted function (gene copy number). Negative difference in gene copy numbers indicate loss of function in treatment-naïve (TN) patients in that metabolic pathway. Differences are calculated by subtracting the predicted gene copy number in 1 group from another (refer to this figure). For example, the metabolic pathway associated with purine metabolism (first pathway on x-axis) displayed the greatest loss of function in TN samples compared to both control samples and samples from patients in remission. There was a median reduction of −3391,471 (TN—control) and −356,6025 (TN—remission) gene copies between samples indicating significantly reduced functional capability in this metabolic pathway in patients with TN IBD. Controls and patients in remission were not statistically different (P = .86). There are statistically significant differences in function (gene copy number) between both TN and controls (P = .038), and TN and patients in remission (P = .027) across all 147 Kyoto Encyclopaedia of Genes and Genomes (KEGG) pathways. Statistical analysis was with Shapiro–Wilk normality test (distribution of data) and Mann–Whitney U test (functional analysis). Please refer to Supplementary table 1 for clarification of KEGG pathways and exact gene copy number differences. IBD = inflammatory bowel disease.