
Figure 2.
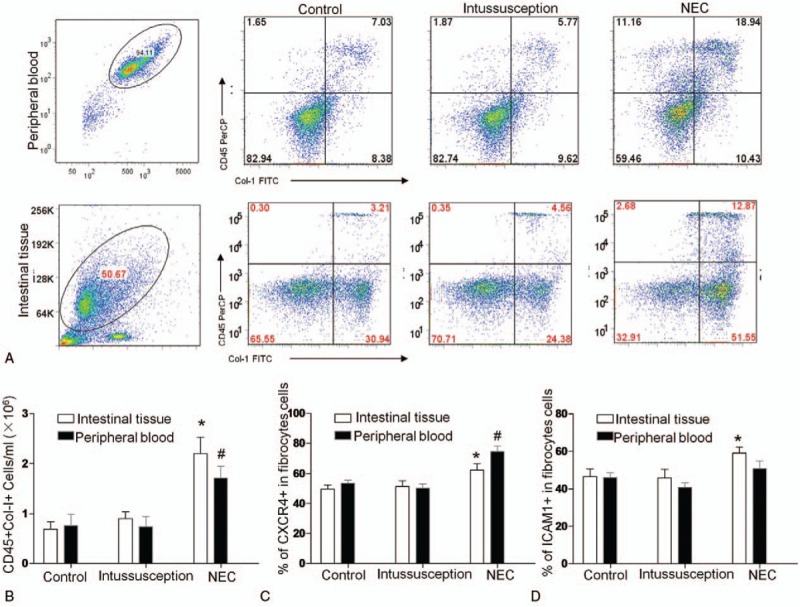
Flow cytometric analysis of circulating fibrocytes and their subpopulations in NEC patients, patients who required resection for noninflammatory conditions of the gastrointestinal tract and normal subjects. (A) Representative flow cytometry analysis of CD45+Col-I+fibrocytes. The histogram indicates the average number of (B) CD45+Col-I+, (C) CD34+CD45+Col-I+, (D) Col-I+CD45+CXCR4+, and (E) Col-I+CD45+ αSMA cells that are present (n = 20). The data are expressed as the mean ± SEM. ∗P < .05, †P < .05, vs Control, 1-way ANOVA.