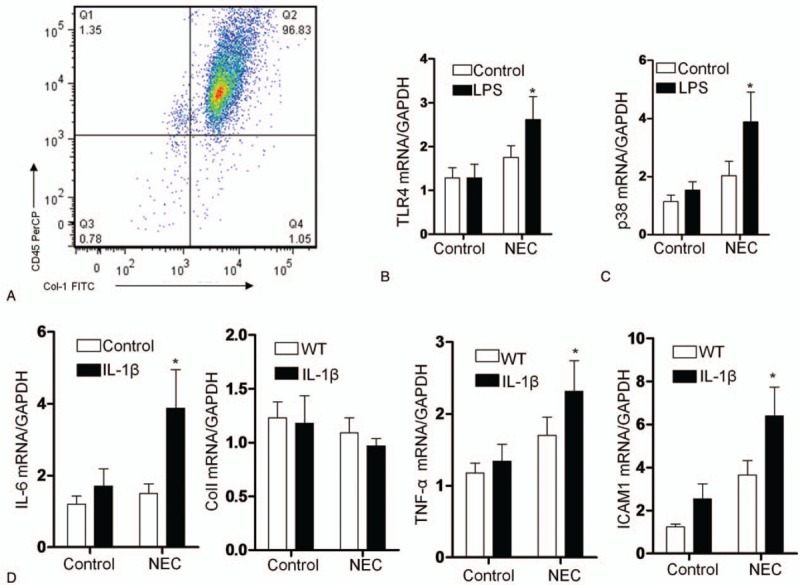
Figure 4.

Gene expression in cultured human fibrocytes. (A) The histogram indicates the flow cytometric analysis of cultured fibrocytes with CD45+Col-I+ cells. Comparison of the TLR4 (B) and p38 mRNA (C) expression levels in cultured fibrocytes from patients treated with LPS (10 μg/mL) for 24 hours. (D) Comparison of the TNF-α, IL-6, ColI, and ICAM1 mRNA expression levels in cultured fibrocytes treated with IL-1β (10 ng/mL) for 24 hours. The expression levels were calculated as the mean level of induction compared to the housekeeping gene β-actin. Columns: average values of a minimum of three independent experiments; bars: ±SEM. ∗P < .01 compared with the corresponding air-exposed control (1-way ANOVA). ICAM1 = intercellular cell adhesion molecule-1.
