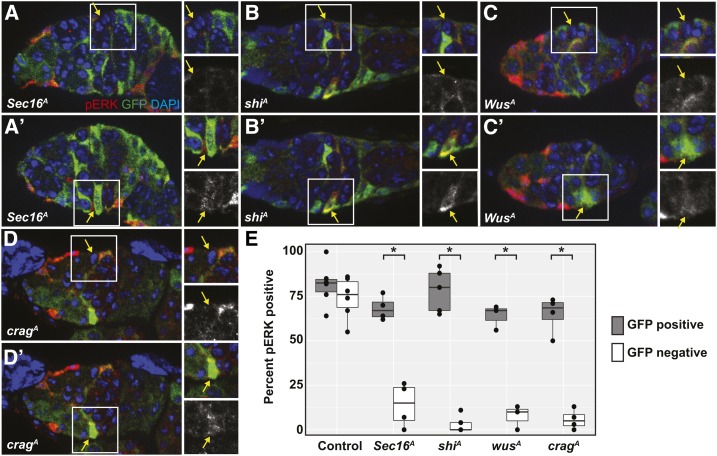
Figure 6.
(A–D) Germaria with (A) Sec16A, (B) ShiA, (C) WusA, or (D) CragA clones stained for pERK (red), GFP (clonal marker, green), and DAPI (blue). Images are oriented so that the GFP− FSC is at the top of the image as shown in (A–D), and the GFP+ FSC is at the bottom as shown in (A′–D′). Each FSC (indicated by a yellow arrow within the white boxes) is shown in the insets to the right of each image. The insets show a merge of all three channels, and the pERK channel alone. Each image is an optical section selected from a z-stack to best capture the indicated FSC. For all four genotypes, the homozygous mutant GFP− FSC has low or undetectable pERK staining, and the heterozygous GFP+ FSC in the same germarium has normal levels of pERK staining. (E) Quantification of the frequency of pERK staining in FSCs that are heterozygous (GFP+, gray boxes) or homozygous (GFP−, white boxes) for the chromosome arm with the allele indicated on the x-axis. Three to five independent trials were conducted for each genotype; each ● indicates the mean values from a single trial. N = 53–77 germaria scored (total from all three to five trials) for each genotype. Boxes show the mean and the first and third quartiles of the means from each trial. * P < 0.01.

