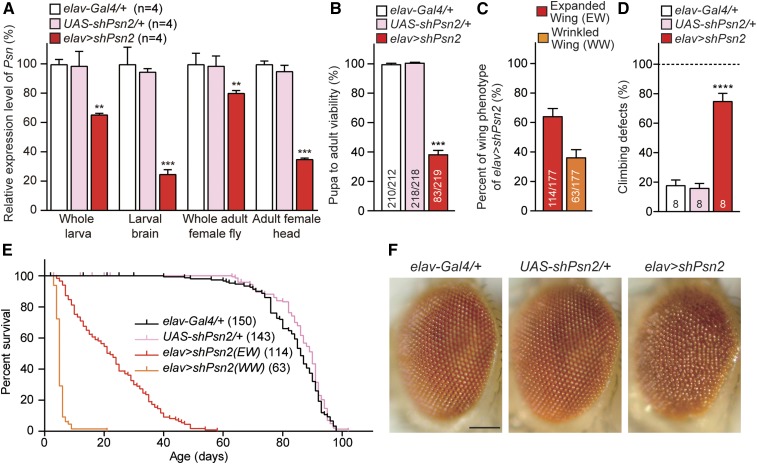
Figure 3.
Severe early mortality, climbing defects and rough eyes in elav > shPsn flies. (A) Significant reduction of Psn mRNA level in elav > shPsn2. qRT-PCR analysis of Psn mRNA levels in third-instar larvae (whole larvae or dissected brains) or 3-day-old adults (whole flies or heads only). Psn mRNA levels were normalized to rp49 mRNA levels as internal control. Total RNA was extracted from whole larvae (five larvae per genotype), larval brains (15 brains per genotype), whole adult females (five adults per genotype) or adult female heads only (20 heads per genotype). n = 4 independent experiments. (B) Neuron-specific KD of Psn reduces pupa-to-adult viability. Viability was calculated by dividing the total number of flies by the total number of pupae, and shown as the percentage of pupae surviving to adulthood. No male flies eclosed from elav > shPsn2 pupae (0/219), and the number of adult females (83/219) were lower than anticipated. n = 11 independent experiments; ≥210 flies per genotype (∼20 flies per experiment) were used in the study. (C) Neuron-specific Psn KD results in defects on wing expansion. Percentage of elav > shPsn2 flies with expanded or wrinkled wing phenotypes. 63.9 ± 5.6% of elav > shPsn2 flies had normal expanded wings (EW; red) and 36.1 ± 5.6% of flies had wrinkled wings (WW; orange). n = 4 independent experiments. (D) Neuron-specific Psn KD causes defects in climbing ability. Only elav > shPsn2 females with normal expanded wings were used for the climbing assay. Bar indicates percentage of failed climbers. Age = 3 days, n = 8 independent experiments; ≥150 flies per genotype (∼20 flies per experiment) were used in the study. (E) Neuron-specific Psn KD causes severe mortality. Survival of Gal4 control (elav-Gal4/+, black), UAS control (UAS-shPsn2/+, pink), and neuron-specific Psn KD flies (elav-Gal4/+;; UAS-shPsn2/+) with expanded wings (EW, red) and wrinkled wings (WW, orange). Lifespans were plotted by the Kaplan-Meier method. (F) Neuron-specific Psn KD causes rough eye phenotypes. Representative images of the control and ealv > shPsn2 eyes are shown. Bar, 0.1 mm. All data are expressed as mean ± SEM. Statistical analysis was performed using one-way ANOVA with Dunnett’s post hoc comparisons. **P < 0.01, ***P < 0.001, ****P < 0.0001.

