Figure 1.
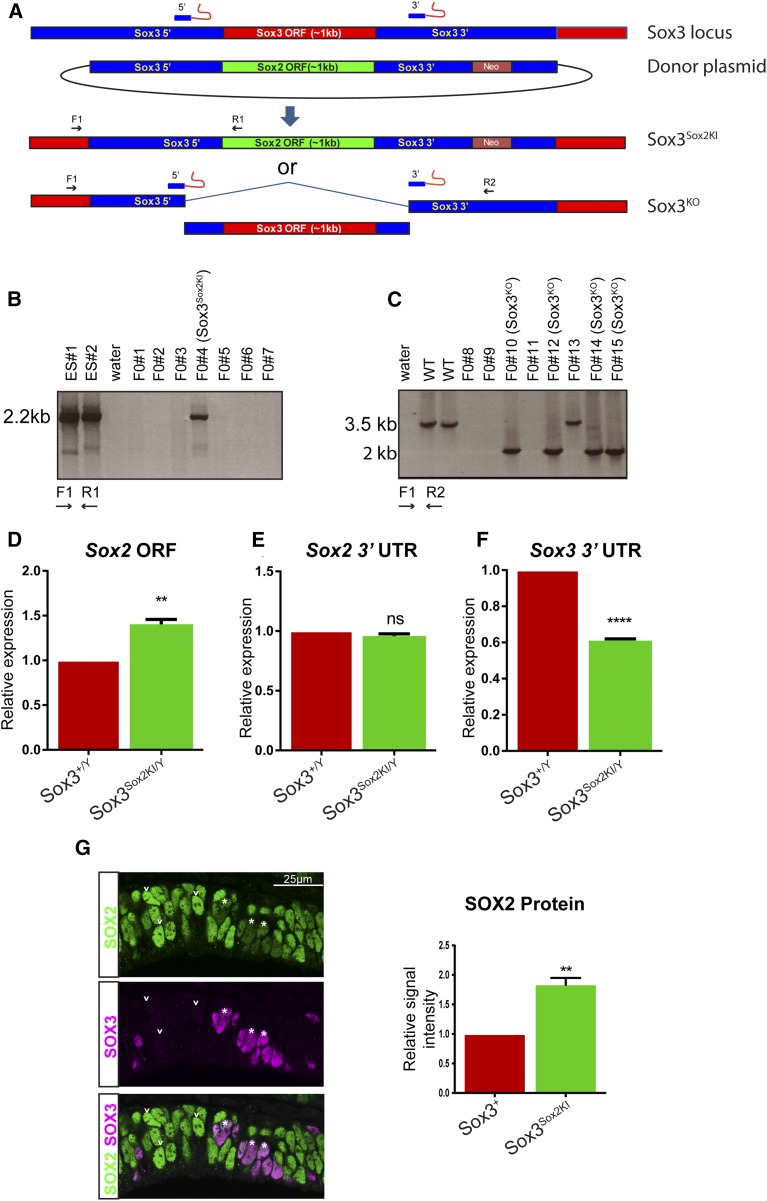
Generation of Sox3Sox2KI and Sox3KO mice with CRISPR mutagenesis. (A) Schematic showing the strategy for generation of the Sox3Sox2KI mice. (B, C) PCR screening of founder mice. (D) Sox2 transcript levels were measured in 11.5 dpc brains by qPCR with primers located in the Sox2 ORF. (E) qPCR showing expression from the endogenous Sox2 locus using primers located in the 3′UTR. (F) Transcription from the Sox3 locus was reduced in Sox3Sox2KI/Y as determined by qPCR with primers located in the Sox3 3′UTR. (G) SOX3 and SOX2 coimmunostaining in the ventral diencephalon of 12.5 dpc Sox3Sox2KI/+ embryos. Asterisks indicate SOX3 positive cells, and arrowheads indicate SOX3 negative cells. Quantification of SOX2 staining intensity in SOX3 positive and SOX3 negative cells (n = 3 embryos).

