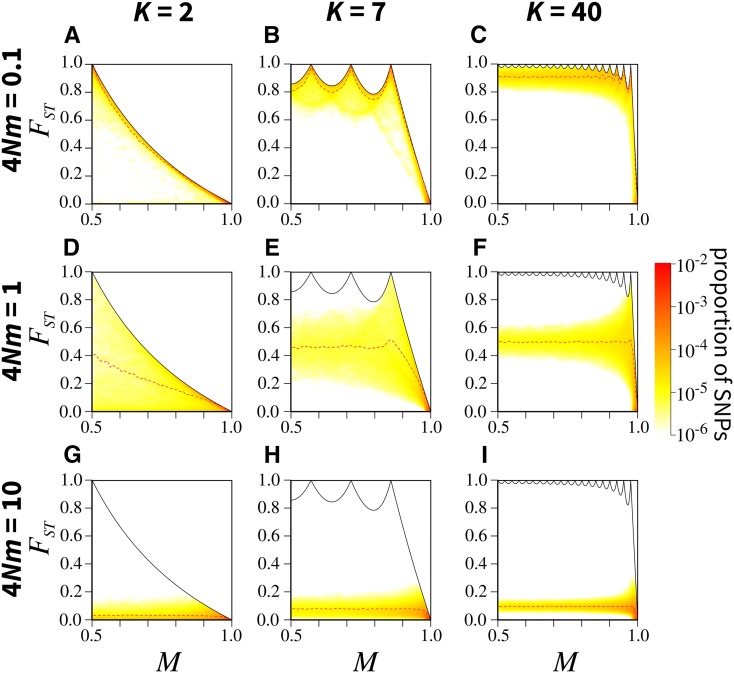
Figure 3.
Joint density of the frequency M of the most frequent allele and in the island migration model, for different numbers of subpopulations K and scaled migration rates (where N is the subpopulation size and m the migration rate): (A) (B) (C) (D) (E) (F) (G) (H) and (I) The black solid line represents the upper bound on in terms of M (Equation 5); the red dashed line represents the mean in sliding windows of M of size 0.02 (plotted from 0.51 to 0.99). Colors represent the density of SNPs, estimated using a Gaussian kernel density estimate with a bandwidth of 0.007, with density set to 0 outside of the bounds. SNPs are simulated using coalescent software MS, assuming an island model of migration and conditioning on one segregating site. See Figure S5 in File S1 for an alternative algorithm for simulating SNPs. Each panel considers 100,000 replicate simulations, with 100 lineages sampled per subpopulation. Figures S2 and S3 in File S1 present similar results under finite rectangular and linear stepping-stone migration models.

