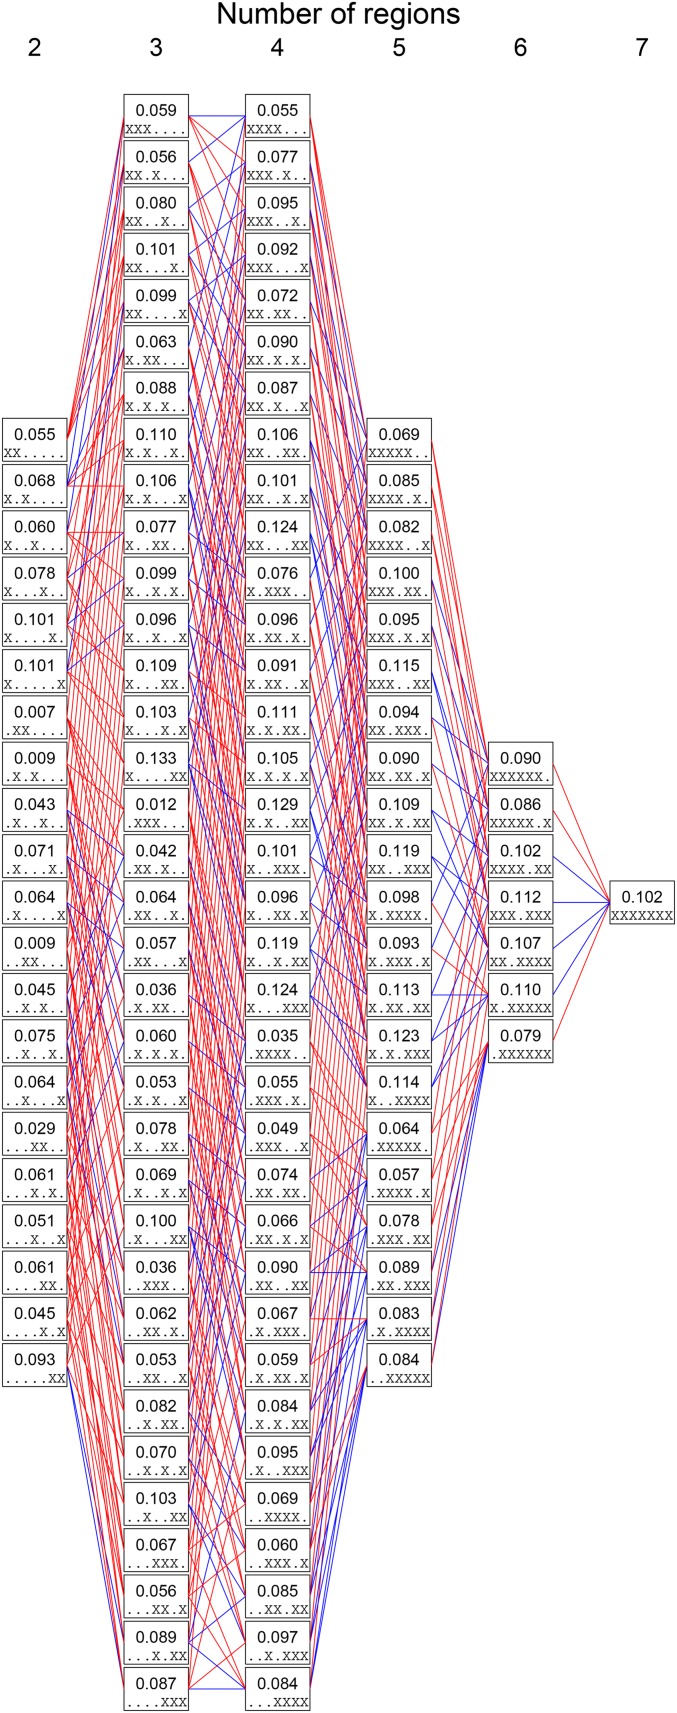
Figure 5.
Mean values across loci for sets of geographic regions. Each box represents a particular combination of two, three, four, five, six, or all seven geographic regions. Within a box, the numerical value shown is among the regions. The regions considered are indicated by the pattern of “.” and “X” symbols within the box, with X indicating inclusion and “.” indicating exclusion. From left to right, the regions are Africa, Middle East, Europe, Central/South Asia, East Asia, Oceania, and America. Thus, for example, X...X.. indicates the subset {Africa, East Asia}. Lines are drawn between boxes that represent nested subsets. A line is colored red if the larger subset has a higher value, and blue if it has a lower Computations rely on 577,489 SNPs from the HGDP.

