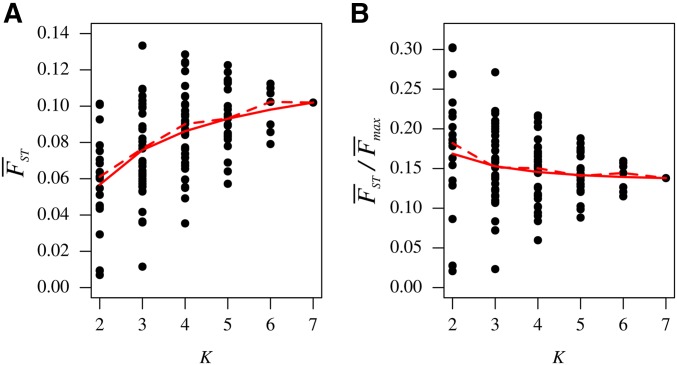
Figure 6.
values for sets of geographic regions as a function of K, the number of regions considered. (A) computed using Equation 10. (B) computed using Equation 11. For each subset of populations, the value of is taken from Figure 5. The mean across subsets for a fixed K appears as a solid red line, and the median as a dashed red line.

