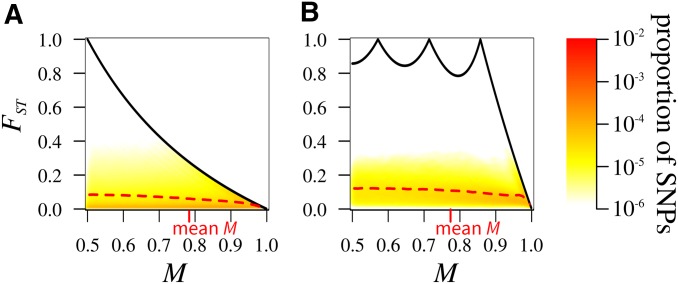
Figure 7.
Joint density of the frequency M of the most frequent allele and in human population-genetic data, considering 577,489 SNPs. (A) computed for pairs of geographic regions. The density is evaluated from the set of values for all 21 pairs of regions. (B) computed among geographic regions. The figure design follows Figure 3.

