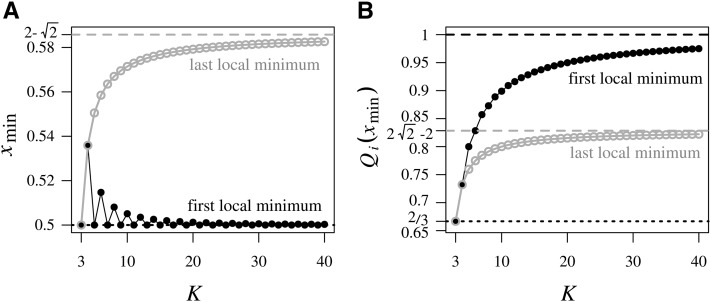
Figure B1.
The first and last local minima of as functions of the frequency M of the most frequent allele, for subpopulations. (A) Relative positions within the interval of the first and last local minima, as functions of K. The position of the local minimum in interval is computed from Equation B1. If K is odd, then this position is if K is even, then it is The position of the last local minimum is Dashed lines indicate the smallest value for of and the limiting largest value of (B) The value of the upper bound on at the first and last local minima, as functions of K. These values are computed from Equation 5, taking and with as in part (A). Dashed lines indicate the limiting values of 1 and for the first and last local minima, respectively.

