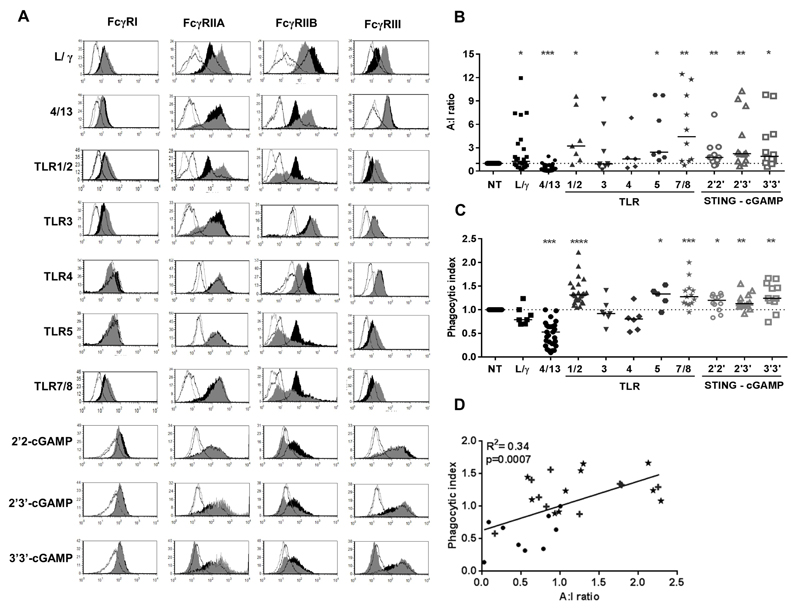
Figure 4. FcγR expression and ADCP of tumor cells following stimulation of hMDM with TLRa or STINGa.
(A) FcγR changes [Open black histogram: Iso ctrl for NT macrophage, Filled black histogram: Expression of FcγR on NT macrophage, Open grey histogram: Iso ctrl for TLRa/STINGa treated macrophage, Filled grey histogram: Expression of FcγR on TLRa/STINGa treated macrophage], B) A:I ratio and C) phagocytic index of hMDM following stimulation with LPS/IFN-γ (L/γ) IL-4/-13 (4/13), TLRa or STINGa. (n=6-25; Wilcoxon test) (D) Correlation between A:I ratio and phagocytic index (★ STINGa hMDM, + TLRa hMDM, ● NT, 4/13 and L/γ hMDM, analysed by linear regression).

