Fig. 5.
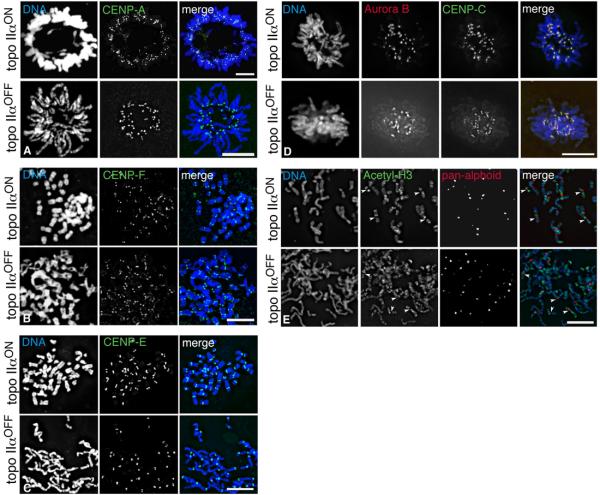
Immunofluorescence of topo IIα-expressing and topo IIα-depleted (72 hours dox) HTETOP cells. (A) Metaphases (cytospun, no colcemid) stained using an antibody against CENP-A (green); (B) partial chromosome spreads (colcemid) stained for CENP-F (green); (C) partial metaphase spreads (colcemid) stained for CENP-E (green)); (D) typical metaphase cells (grown in situ, no colcemid) stained for CENP-C (green) and Aurora B (red); (E) immuno-FISH of partial chromosome spreads (colcemid) showing the typical banding pattern generated using an antibody raised against acetylated histone H3 (Lysines 1-21) (green). The centromeric regions have been identified using a pan-alphoid DNA probe (red). The white arrowheads highlight examples of hypoacetylated centromeric and pericentromeric domains. DNA/DAPI - blue. Scale bars, 10 μm.

