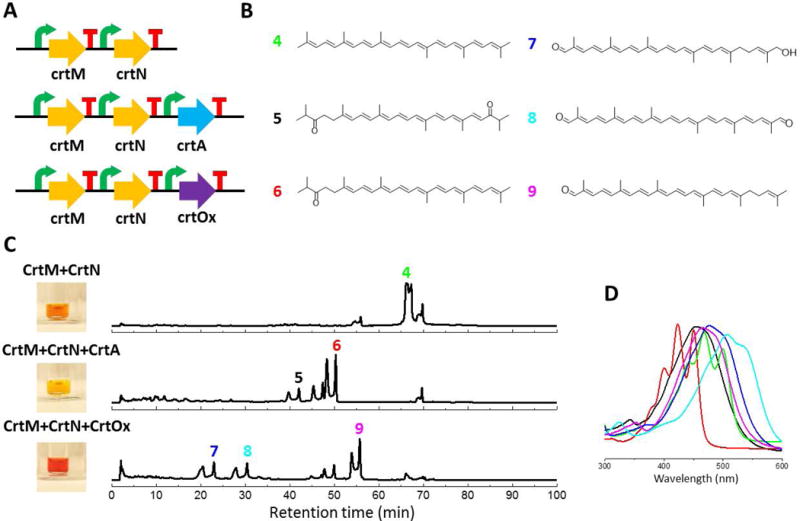
Figure 4.

Analysis of the C30 carotenoid producing pathways expressed in E. coli. (A) Pathways refactored for analysis. (B) Structures of carotenoids expected to be produced. (C) HPLC-UV traces. (D) UV absorption of the corresponding peaks. MS data is shown in Figure S2.
