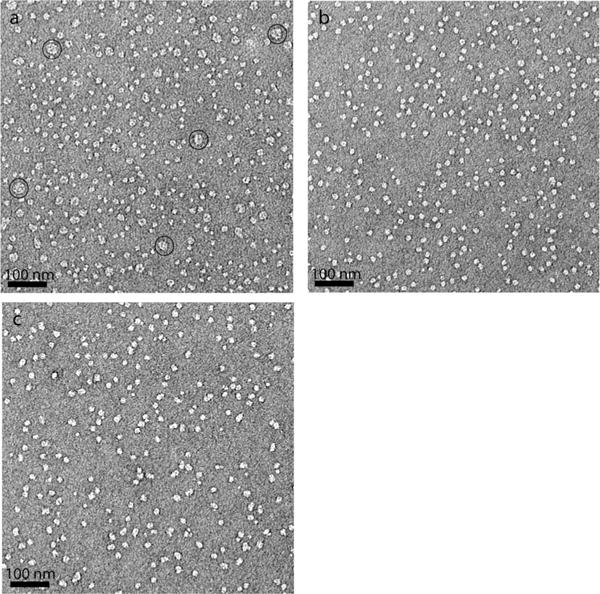
Figure 4.

Negative stain electron micrographs for β2AR purified in DDM (a), MNA-C13 (b) and MNA-C14 (c). Individual samples (3 μL) were stained with 1.0 wt.% uranyl formate for the electron micrographs. A number of large particles present in (a) indicate occurrence of receptor aggregation in the DDM sample. Some large particles as representatives were indicated by open circles.
