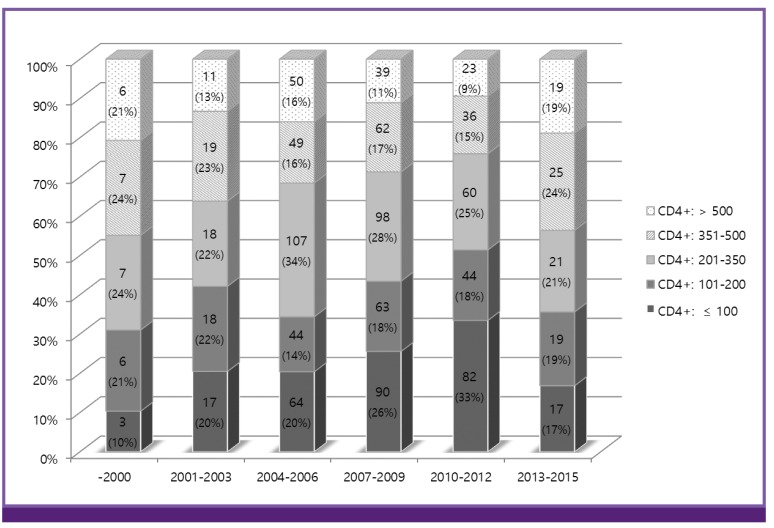
Figure 1.
The trend of CD4+ cell count at the time of diagnosis by 3-year intervals. As of 2015, a total of 1,124 HIV-infected patients were included. Each period was stratified by grade of CD4+ cell count: ≤100, 101-200, 201-350, 351-500, and >500 cells/mm3. Values are presented as number (percentage).

