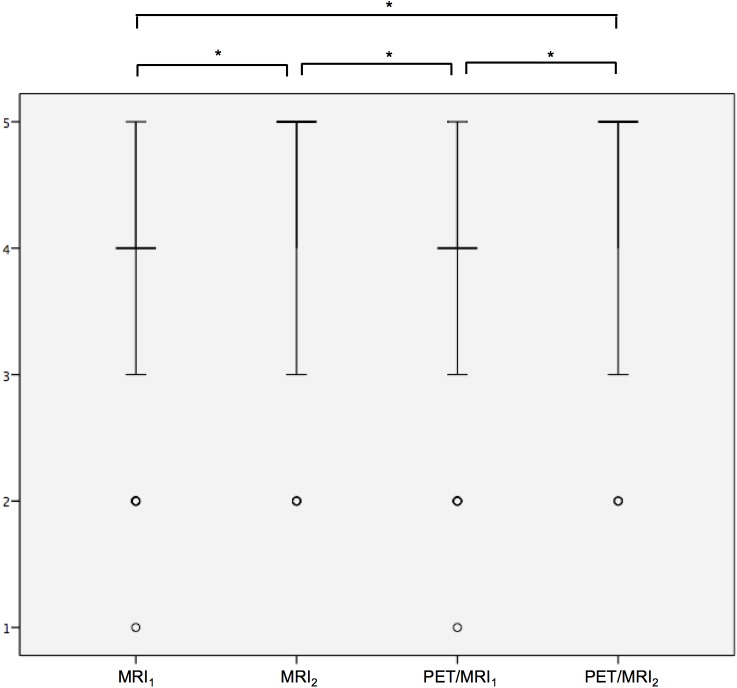
Fig 4. Diagnostic confidence is significantly higher in PET/MRI2 and MRI2 datasets compared to PET/MRI1 and MRI.
Ratings for lesion conspicuity are entered on the y-axis. The vertical bar represents the upper and lower quartiles; the horizontal bar represents the median. The points represent extreme values. Significant differences are marked by a star.

