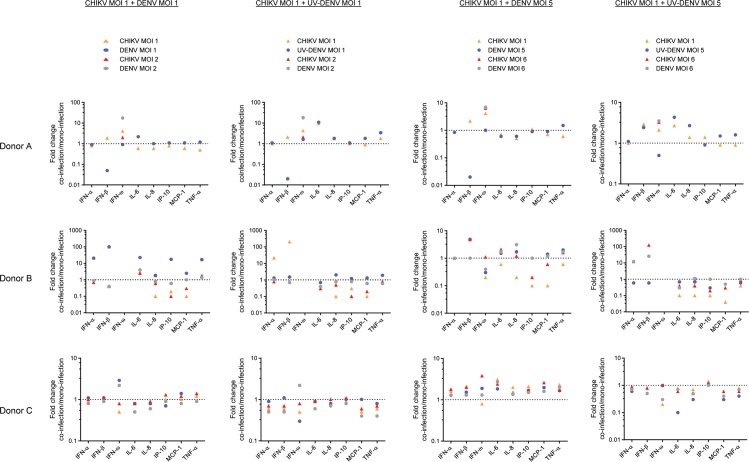
Fig 2. Innate immune signature of the co-infection vs mono-infection.
Chemokine and cytokine levels produced following different mono- and co-infection regimens in hPBMCs were measured by ProcartaPlex. Each graph shows the fold-change of concentration of the immune factor during co-infection relative to the indicated mono-infection. All concentrations shown correspond to 24 hpi, except for that of IFN-ω, which peaked in all donors at 48 hpi.

