. 2017 Jun 22;60(6):181–188. doi: 10.3345/kjp.2017.60.6.181

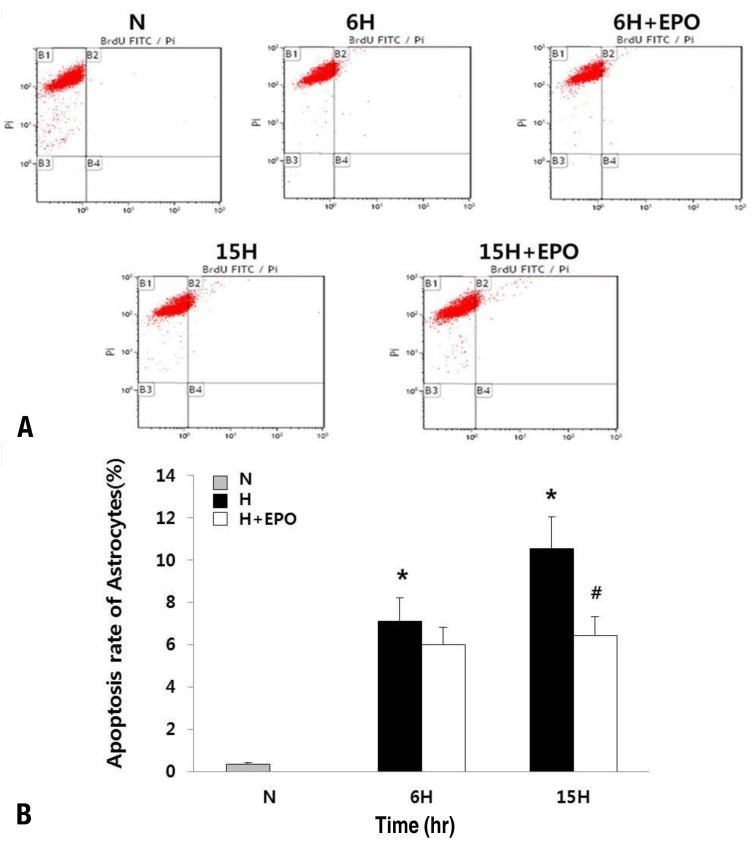
Fig. 3. Apoptosis in the astrocytes. Apoptosis was assessed by the quantification of BrdU-FITC-labeled DNA breaks using a flow cytometry-based terminal deoxynucleotidyl transferase dUTP nick end labeling assay in the astrocytes. Two dyes, propidium iodide (total cellular DNA) and fluorescein (apoptotic cells), were used. (A) Apoptotic cells can be seen in the B2 gate. (B) The percentage of total apoptotic cells is shown in the histogram. N, normoxic group; 6H, hypoxic group that was exposed to hypoxia for 6 hours; 6H+erythropoietin (EPO), hypoxic group pretreated with EPO that was exposed to hypoxia for 6 hours; 15H, hypoxic group that was exposed to hypoxia for 15 hours; 15H+EPO, hypoxic group pretreated with EPO that was exposed to hypoxia for 15 hours. *P<0.05, statistically significant vs. N group. #P<0.05, statistically significant vs. H group.

Fig. 3