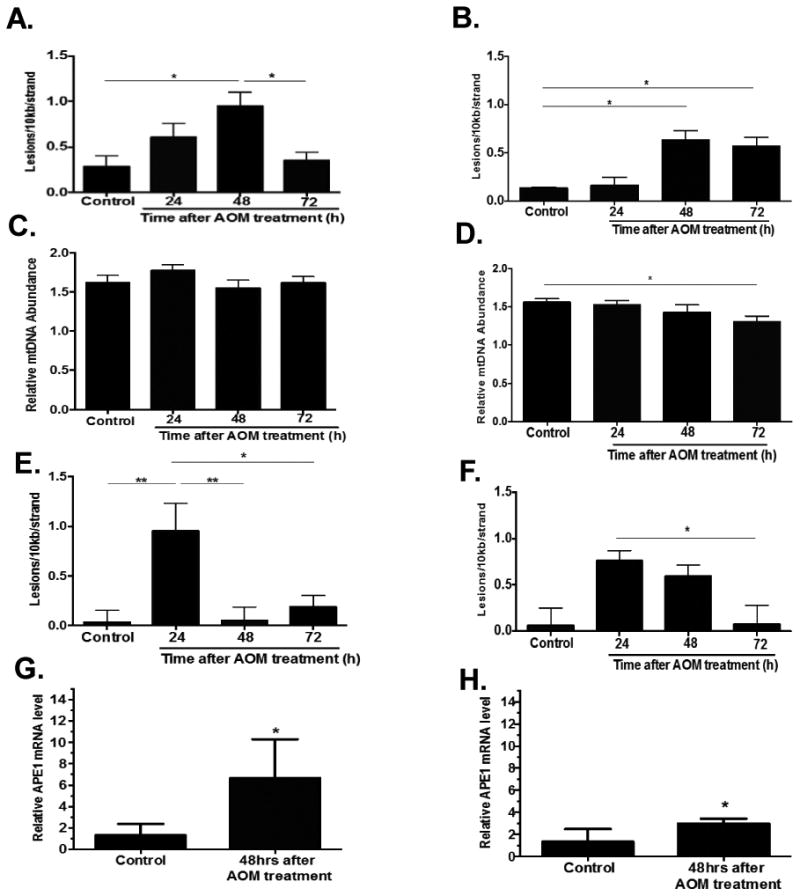
Figure 1. Detection of DNA damage and APE1 mRNA levels induced by AOM.

Total DNA from colonic crypts was isolated 24, 48, and 72 hrs after AOM treatment from WT and Apex1+/- mice and analyzed for mtDNA damage, mtDNA abundance, and nDNA damage by QPCR. (A) Frequency of mtDNA lesions in WT mice. (B) Frequency of mtDNA lesions in Apex1+/- mice. C) Relative mtDNA abundance in WT. (D) Relative mtDNA abundance in Apex1+/- mice. (E) Frequency of nDNA lesions in WT mice. (F) Frequency of nDNA lesions in Apex1+/- mice. Results are expressed as mean ± SEM values for 3 QPCRs performed in triplicate. (G) Relative APE1 mRNA levels in WT mice 48 hours after AOM treatment. (H) Relative APE1 mRNA levels in Apex1+/- mice 48 hours after AOM treatment. WT and Apex1+/- mice: N=8 for Saline treated mice; N=9 mice 24 hr AOM treatment; N=9 mice 48 hr AOM treatment; N=8 mice, 72 hr AOM treatment. Asterisks (*) denote statistical significance (One-way ANOVA, *P<0.05, **P<0.01).
