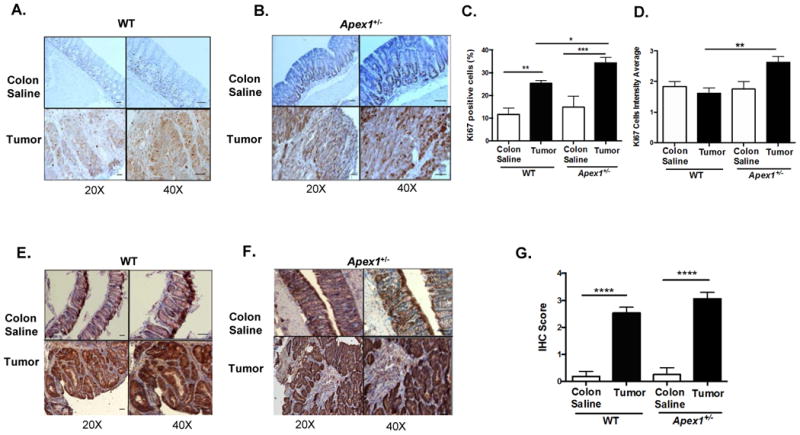
Figure 2. Immunohistochemical detection of Ki-67 and β-catenin in AOM-induced tumors from WT and Apex1+/- mice.

(A) and (B) Representative pictures of Ki-67 staining in colonic and tumor tissues from WT and Apex1+/- mice, respectively. Brown staining represents positive cells. (C) and (D) Quantification of Ki-67 positive cells and Ki-67 staining intensity, respectively. (E) and (F) Representative pictures of β-catenin staining in tumor and colonic tissues from WT and Apex1+/- mice, respectively. Brown nuclear staining represent positive cells. (G) Quantification of β-catenin staining in colonic and tumor tissues. Results are expressed as mean ± SEM values. The parameters for IHC score were as follows: 1 = <25% staining; 2 = 25-50% staining; 3 = 50-75% staining; 4 = >75% staining. N=4 WT colon saline and N=2 Apex1+/- colon saline, N=4 AOM-induced tumors from both WT and Apex1+/- mice. Scale bars represent 20 μm and 50 μm at 20 × and 40 × magnification, respectively. Asterisks (*) denote statistical significance (One-way ANOVA, *P<0.05; **P<0.01; ***p<0.001; ****P<0.0001).
