. 2017 Jun 26;20(2):132–141. doi: 10.4048/jbc.2017.20.2.132

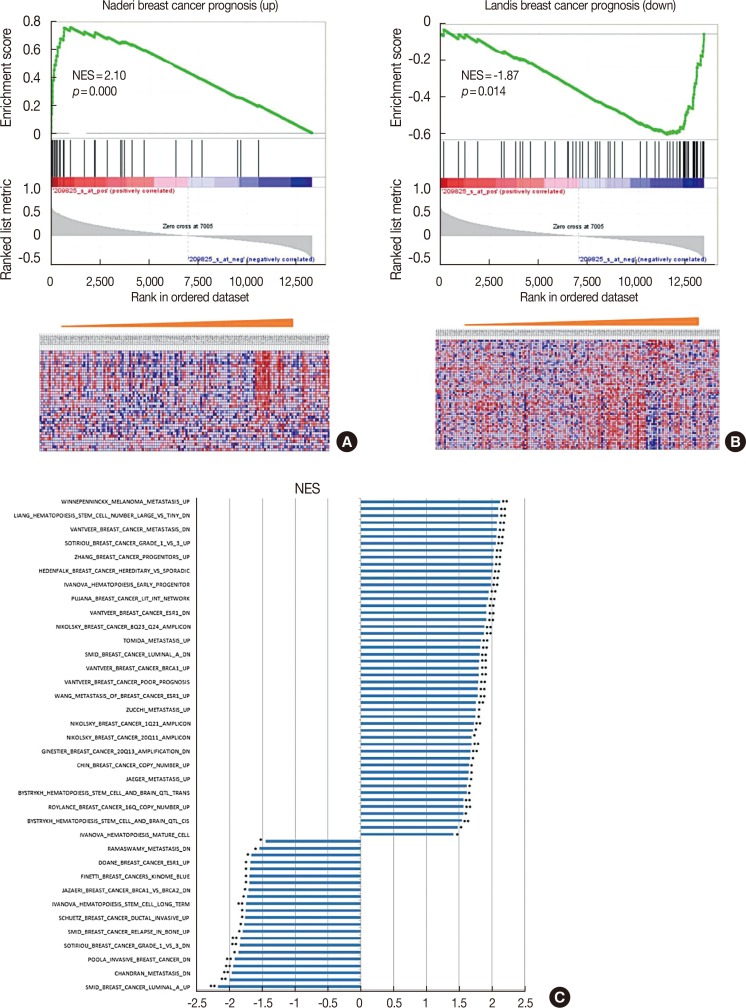
Figure 3. Enriched gene signatures associated with aggressiveness and prognosis in UCK2-high and -low breast cancers. Normalized enrichment score (NES) represents the NES for the gene-set enrichment analyses. The ranked list metric was generated by calculating the signal-to-noise ratio, which is based on the difference of means scaled according to the standard deviation. The larger the signal-to-noise ratio, the more distinct the gene expression is for each phenotype. The heat maps show the enrichment of genes in the gene sets. Columns are individual samples and rows represent each gene. Blue indicates a low level of expression, and red indicates a high level of expression. (A, B) are the examples showing that UCK2 expression levels were inversely associated with breast cancer prognosis, and (C) shows the genes coexpressed with UCK2 were enriched in biological pathways associated with tumor grade, molecular subtype, cancer invasiveness, metastasis, and prognosis.

Figure 3