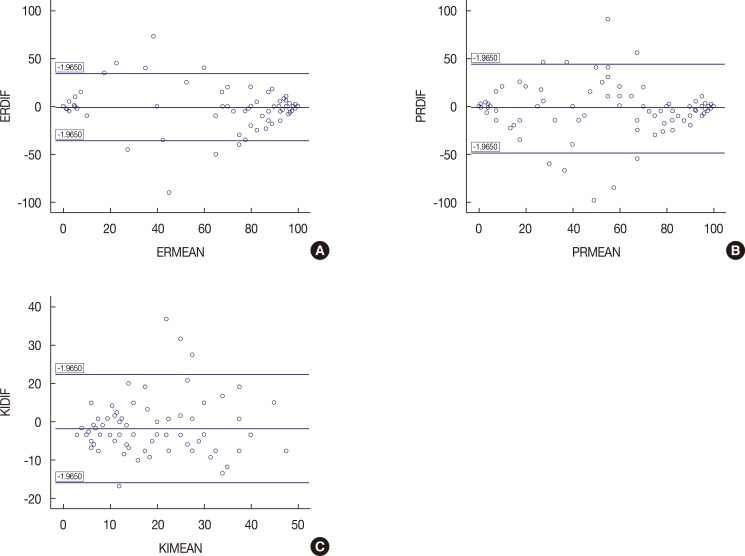
Figure 2. Bland-Altman plots for concordance analysis. Agreement in primary breast tumors and synchronous axillary lymph node metastases for (A) estrogen receptor (ER) expression, (B) progesterone receptor (PR) expression and (C) Ki-67 expression. Y-axis shows the difference between the two paired measurements (measurement in primary breast tumors–measurement in nodal metastases) and the X-axis represents the average of these measures ([measurement in primary breast tumors+measurement in nodal metastases]/2). The difference of the two paired measurements is plotted against the mean of the two measurements. Ninety-five percent of the data points lie within±2 SD of the mean difference showing good correlation.
ERDIF=ER percentage difference between breast tumor and nodal metastases; ERMEAN=ER percentage mean between breast tumor and nodal metastases; PRDIF=PR percentage difference between breast tumor and nodal metastases; PRMEAN=PR percentage mean between breast tumor and nodal metastases; KIDIF=Ki-67 percentage difference between breast tumor and nodal metastases; KIMEAN=Ki-67 percentage mean between breast tumor and nodal metastases.

