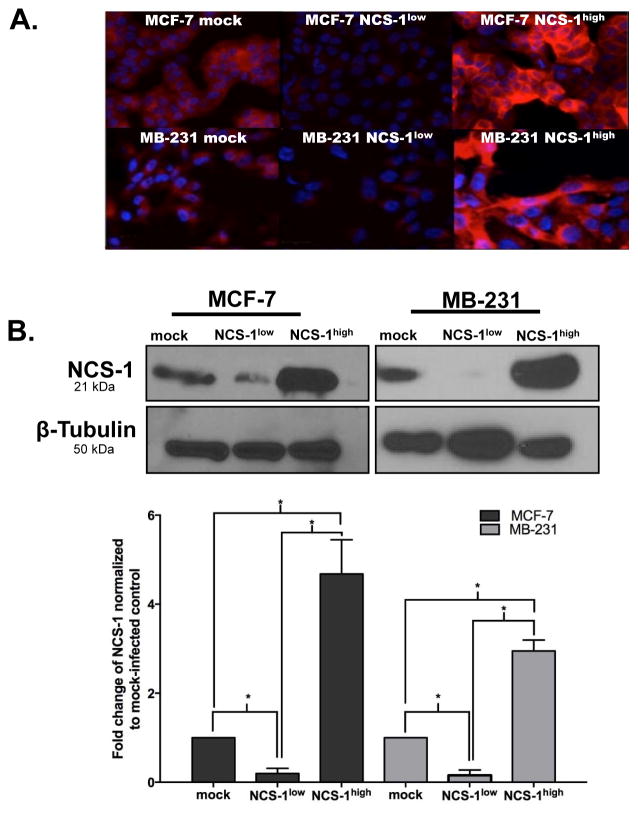
Figure 2. Validation of Stable Breast Cancer Cell Lines.
A. Representative immunofluorescent images of MCF-7 and MB-231 cell lines that were generated with commercially available lentiviral particles to overexpress or knockdown the NCS-1 protein. Cells were fixed and stained for NCS-1 (red) and DAPI (blue). B. Representative immunoblots show the relative amounts of NCS-1 and β-tubulin in the stable breast cancer cell lines; (below) band densitometry was analyzed using UN-Scan IT, bar graphs, illustrates NCS-1 expression normalized to β-tubulin and expressed as a fold-change relative to mock-infected controls. Results shown are the average of three biological replicates.

