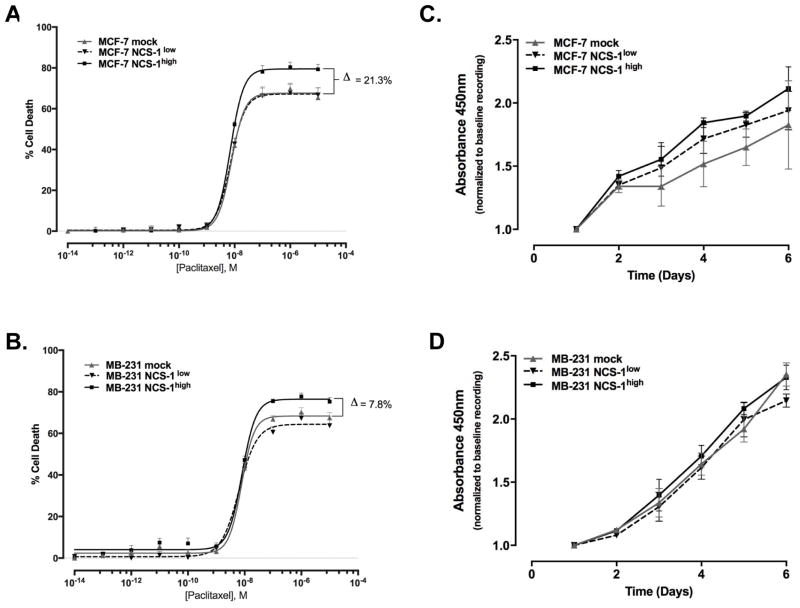
Figure 4. NCS-1 may Promote Paclitaxel-induced Cell Death.
Dose response curves were generated by CellTiterGlo assay after treatment with concentrations of paclitaxel (0.1 pM to 10,000 μM) for 72 hours for A. MCF-7 and B. MB-231 cell lines. The percentage of cell death was calculated using the equation previously described. Cell proliferation was determined by CCK-8 assay to generate a growth curve over six days for C. MCF-7 and D. MB-231 lines. The average absorbance values were calculated, normalized to baseline, and compared in a two-sided student’s t-test.

