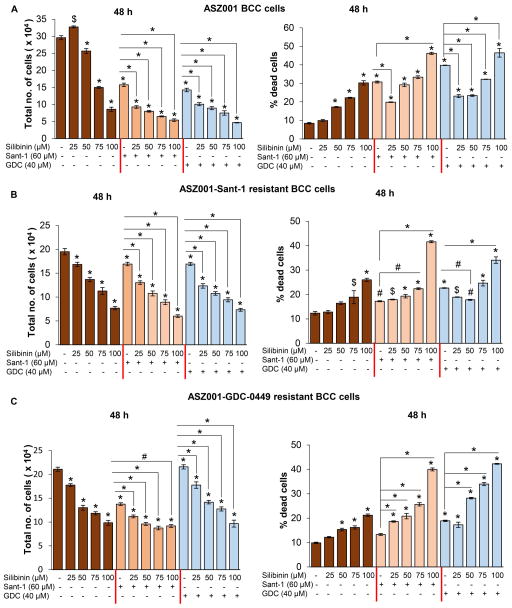
Figure 1.
Effect of silibinin treatment on cell growth in ASZ001, ASZ001 Sant-1 and ASZ001-GDC-0449 BCC cells with or without Sant-1 or GDC-0449 treatment. (A) Effect of silibinin (25–100 μM) treatment for 48 hrs, with or without Sant-1 (60 μM) or GDC-0449 (40 μM), on total cell number (left panel) and cell death (right panel) in ASZ001 cells. (B) Effect of silibinin (25–100 μM) treatment for 48 hrs, with or without Sant-1 (60 μM) or GDC-0449 (40 μM), on total cell number (left panel) and cell death (right panel) in ASZ001-Sant-1 cells. (C) Effect of silibinin (25–100 μM) treatment for 48 hrs, with or without Sant-1 (60 μM) or GDC-0449 (40 μM), on total cell number (left panel) and cell death (right panel) in ASZ001-GDC-0449 cells. Quantitative data are represented as Mean±SEM of three samples. # p≤0.05; $ p≤0.005; * p≤0.001 versus respective control.

