Figure 7.
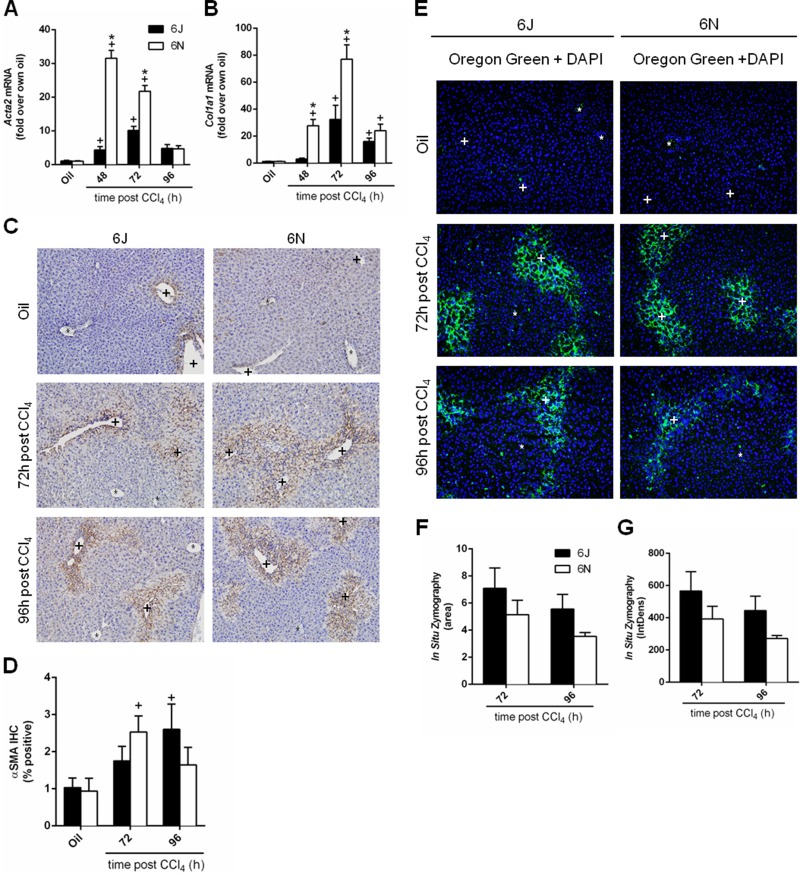
Matrix remodeling following CCl4 exposure. Mice were exposed to CCl4 and euthanized 48, 72, or 96 h later. Hepatic transcript accumulation of (A) Acta2 and (B) Col1a1 was evaluated by real-time PCR. (C) Immunohistochemistry for αSMA, the Acta2 gene product, was performed and (D) quantified as the percent area of positive staining in each image. (E) In situ zymography was used to detect matrix metabolism in frozen liver sections at baseline and at 72 and 96 h after CCl4 exposure. The green fluorescence indicates areas of matrix metabolism. DAPI was used to visualize nuclei. (F) The area and (G) intensity above a set threshold were quantified after in situ zymography. Baseline matrix metabolism was too low to be quantified. Central veins are marked with a +, and portal veins are marked with a *. n = 5–6 per group. *p ≤ 0.05 when comparing substrains at a single time point; +p ≤ 0.05 when comparing the indicated CCl4 time point to the oil (control) of the same substrain.

