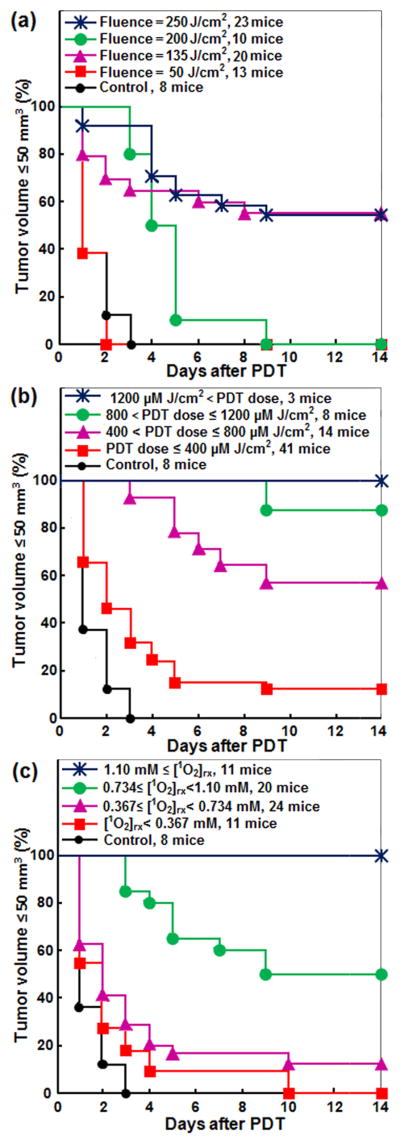
Figure 2.
The impact of a) fluence, b) PDT dose at 3 mm tumor depth, and c) reacted singlet oxygen ([1O2]rx) at 3 mm tumor depth on Kaplan-Meier curves of tumor local control rate (LCR) after Photofrin-mediated PDT. A normalized tumor volume ≤ 50 mm3 was used as the endpoint. The solid dark blue line with star symbols in (b) and (c) corresponds to the complete control of tumors.

