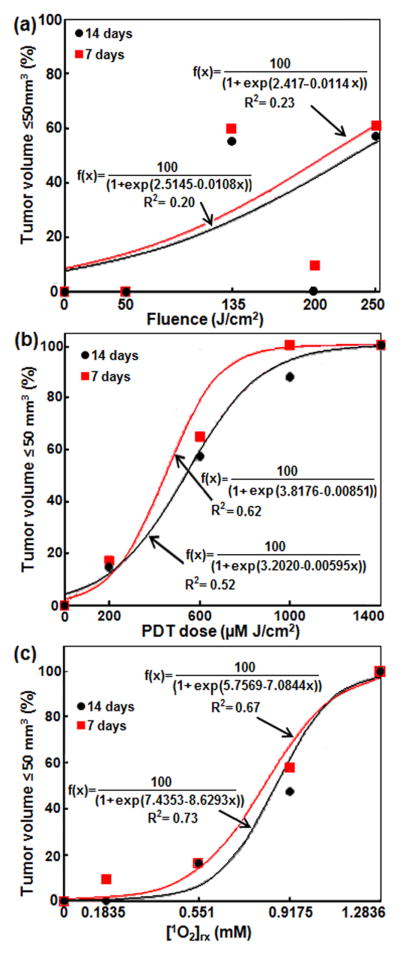
Figure 3.
Tumor local control rate (LCR) at 7 and 14 days versus (a) light fluence, (b) PDT dose at 3 mm tumor depth, (c) [1O2]rx at 3 mm tumor depth. The solid lines are the sigmoid function (y=100/(1+ exp(b-cx)) for (b) and (c) fits, the resulting goodness of fits are R2 = 0.20 (0.33), 0.52 (0.68), 0.72 (0.72) for light fluence, PDT dose at 3 mm, and [1O2]rx at 3 mm for LCR at 14 (7) days, respectively.

