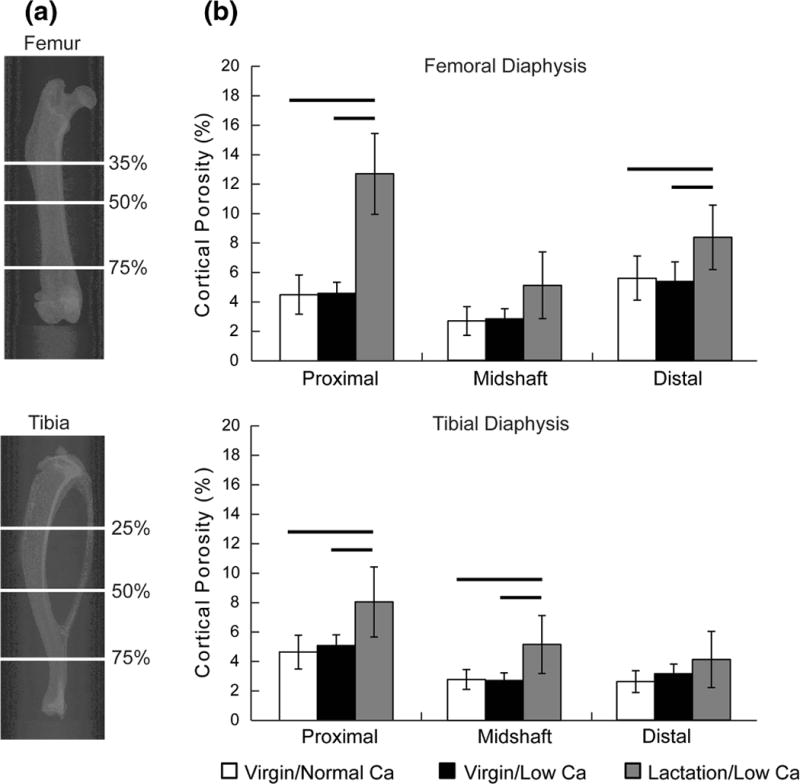
Figure 1.

(a) Representative two-dimensional X-ray images demonstrating the skeletal sites used to characterize cortical porosity in the diaphysis of the femur and tibia. In the femur, the sites were at 35, 50, and 75% of the total length, while in the tibia the sites were at 25, 50, and 75% of the total length. (b) Cortical porosity at all 6 skeletal sites at the end of the induction phase (means and standard deviations). The data demonstrate the dramatic increase in cortical porosity induced by the lactation/low Ca model, but no significant increase in the virgin/low Ca model compared to virgin/normal Ca. There were significant between-group differences at all sites investigated with the exception of the distal tibia (p<0.001, p=0.041, and p=0.031, for the distal, midshaft, and distal femur and p=0.010, p=0.013, and p=0.194, for the proximal, midshaft, and distal tibia, respectively). Bars represent significant between-group differences (p<0.05 for the post-hoc tests).
