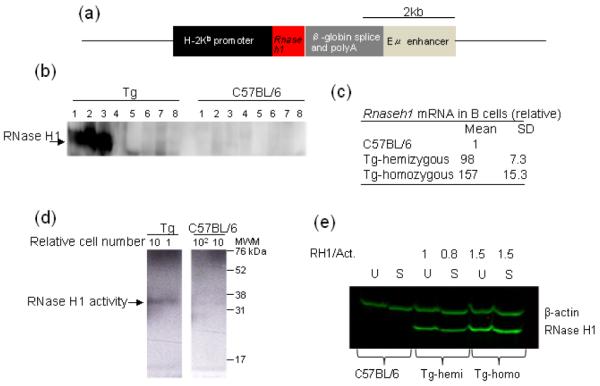
Fig. 1. Transgenic mouse.

Depiction of DNA construct for expressing RNase H1 in B cells (a). Western blot analysis of RNase H1 protein expression in various tissues in hemizygous Tg and C57BL/6 mice. Lanes marked 1 splenic B cells, 2 thymus, 3 bone marrow, 4 brain, 5, heart, 6 kidney, 7 liver, and 8 lung (b). Quantitative PCR of mRNA in C57BL/6, hemizygous Tg and homozygous Tg mice (c). Autoradiograph (reverse image) of RNase H1 activity of resting B cells from hemizygous Tg and C57 BL/6 mice from B cells. Relative number of cells used is indicated above each lane. MWM – molecular weight makers (d). Western blot analysis of RNase H1 from uninduced resting (U) and 48 h stimulated (S) B cells. RH1/Act.is the ratio of signals for RNase H1 and β-actin in each lane. (e).
