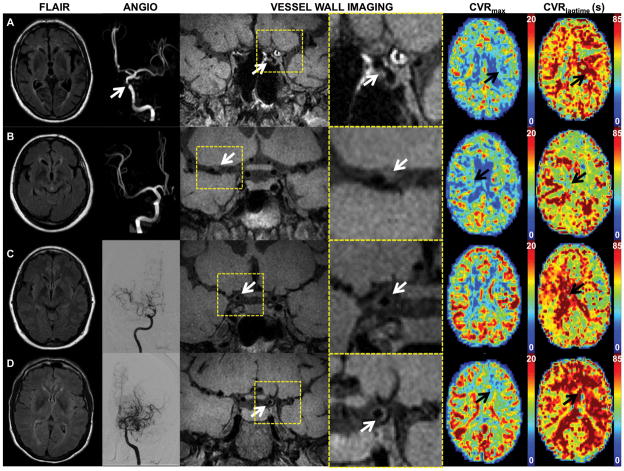
Figure 2.
Axial FLAIR, MRA or DSA, coronal vessel wall imaging (subsection and magnified views), axial maximum CVR and CVR lagtime maps are shown for representative patients. (A) An 83 year male with atherosclerosis and left > right internal carotid artery (ICA) vessel wall lesions and stenosis (white arrows). Left middle cerebral artery (MCA) and anterior cerebral artery (ACA) territories (black arrows) show decreased maximum CVR (CVRmax) and prolonged CVR lagtime (CVRlagtime) compared to the right. (B) 71 year female with atherosclerosis. Vessel wall imaging demonstrates thickening and T1 hyperintensity of the proximal MCA (white arrow). No MCA stenosis is identified on MRA. CVR lagtime is prolonged in the right MCA territory (black arrow). A severe basilar stenosis may account for prolonged CVR lagtimes in the posterior territories bilaterally. (C) Vessel wall imaging in this 44 year female with predominantly right sided moyamoya disease is consistent with concentric thickening of the right terminal ICA (white arrow), proximal ACA, and proximal MCA. DSA right ICA injection shows moyamoya changes of the right anterior circulation. CVR lagtime is prolonged on the right (black arrow), but the maximum CVR is comparable to that on the left. (D) A 49 year female with bilateral, left>right, moyamoya disease and left > right vessel wall thickening of the terminal ICA (white arrow) and moyamoya changes. CVR lagtime is prolonged and maximum CVR decreased in the left ACA and MCA territories (black arrows) compared to the right.

