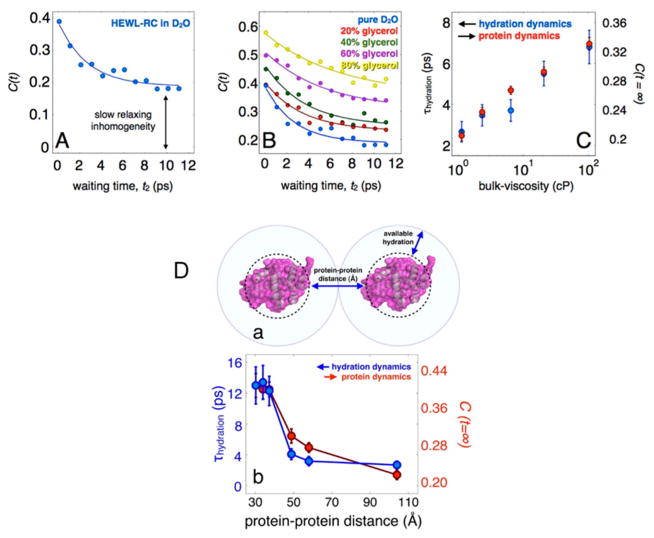
Figure 16.
(A) FFCF of HEWL-RC in pure D2O, highlighting the initial decay due to hydration dynamics and the static offset of the correlation function corresponding to the protein dynamics. (B) Correlation functions for each solvent composition, ranging from pure D2O to 80% glycerol by volume. From the data, it is clear that there is a marked slowing in the hydration dynamics as well as in the protein dynamics (C). Adapted from ref 10. Copyright 2013 Nature Publishing Group. (D) Hydration and protein dynamics of HEWL-RC in crowding conditions plotted as a function of protein–protein distance. The protein–protein distance is defined as the average surface-to-surface distance between proteins using a spherical approximation, which can be estimated for each concentration. Assuming a homogeneous mixture, the average surface-to-surface distance between proteins can be estimated, revealing that the transition occurs at a protein–protein distance of 30–40 Å. Adapted with permission from ref 178 (Copyright 2012 American Chemical Society.) and ref 184 (Copyright 2014 American Chemical Society.).

