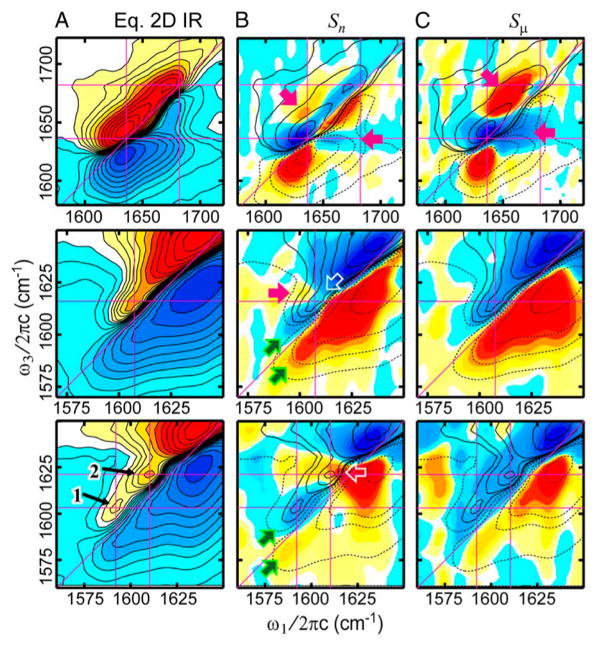
Figure 19.
Transient 2D IR spectra of Trpzip2 isotopologues (top row, unlabeled; middle row, double isotope labeled at T3 and T10 carbonyls; bottom row, isotope labeled at K8 carbonyl) following a temperature jump. (A) 2D IR spectra at T = 150 fs at thermal equilibrium. (B, C) Transient 2D IR basis spectra showing the spectral changes on nanosecond and microsecond time scales. Loss of diagonal peaks is observed as blue above and red below the diagonal line. Contours of the equilibrium and transient spectra are overlaid together. Reproduced with permission from ref 251. Copyright 2013 National Academy of Sciences.

