
Figure 5.
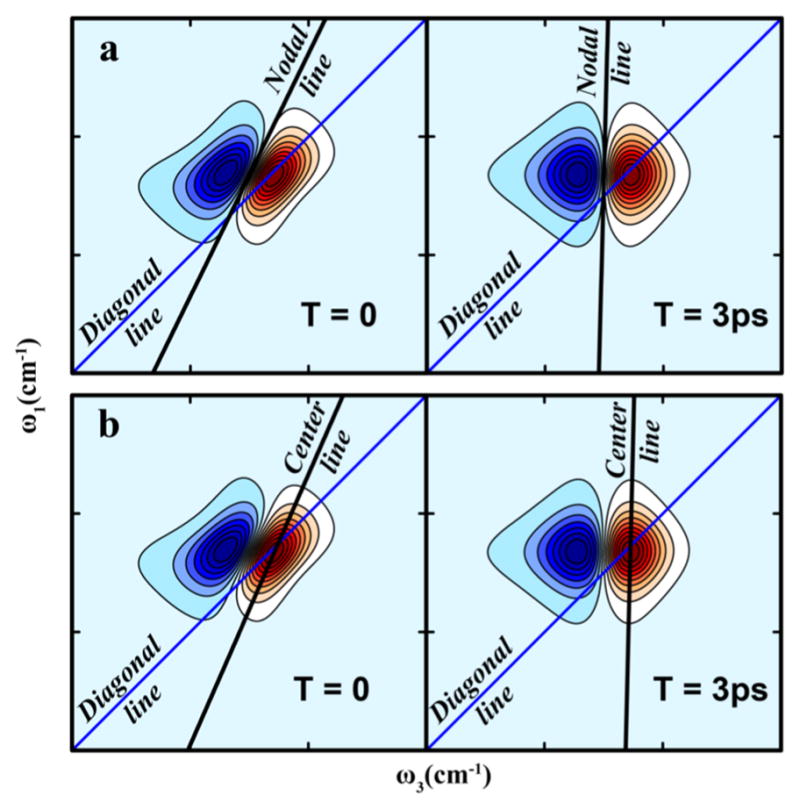
Relaxation of the frequency autocorrelation function (FFCF) is reflected in the waiting time (T) evolution of 2D IR spectra: the spectra are more elongated at early T and become more symmetric at longer T as the FFCF decays. The correlation relaxation can be quantitatively measured through slope of the 2D contours as a function of T. (a) The nodal line slope and (b) the center line slope.