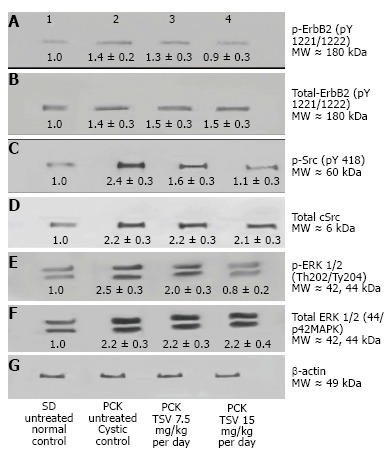
Figure 10.

Target validation in BPK. Western analysis of the MAPK pathway activity of EGFR (p-EGFR), cSrc (pSrc), and ERK1/2 (p-ERK ½) reveals that BPK cystic kidneys have significantly increased levels of active or phosphorylated p-EGFR (A2), pSrc (C2) and ERK1/2 (E2) compared to wild-type BALB/c control levels in lanes (A1, C1 and E1) respectively. TSV treatment at 7.5 or 15 mg/kg per day resulted in a dose dependent reduction in the phosphorylation or activity of p-EGFR (A3 and A4), and p-Src (C3 and C4) that correlated directly to a reduction in the activity of ERK1/2 (p-ERK1/2: E3 and E4).The reduced level of phosphorylated proteins occurred without changes in the level of total EGFR (B2, B3 and B4), total Src (D2, D3 and D4) or total ERK1/2 (F2, F3 and F4). The numbers below the band in each lane represents the average ± SD (n = 3) of the relative density of each band when normalized to the wildtype BALB/c control value arbitrarily set at 1.
