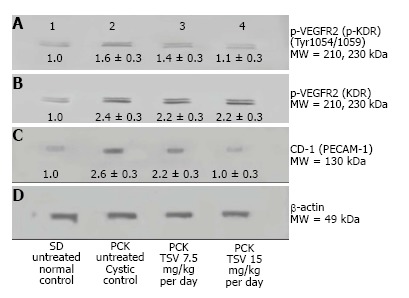
Figure 11.

VEGFR2 (KDR) and CD-31 expression in PCK. Western analysis of the renal expression of VEGF2 (KDR) in PCK (B), and active (p-KDR) in PCK kidneys (A) demonstrate an increased phosphorylation of KDR in untreated cystic PCK kidneys (A2) compared to SD untreated wildtype controls (A1). TSV treatment of PCK at 7.5 (A3) and 15 mg/kg per day (A4) respectively, reduced the level of p-KDR in a dose dependent manner to near normal (wildtype) levels. This reduced p-KDR correlated directly with expression levels of CD-31 shown in C, which was also reduced in a dose dependent manner with TSV treatment. The numbers below the band in each lane represents the average ± SD of the relative density of each band when normalized to the wildtype SD control value arbitrarily set at 1. D is the loading control. Each average represents a minimum of n = 3 individual westerns.
