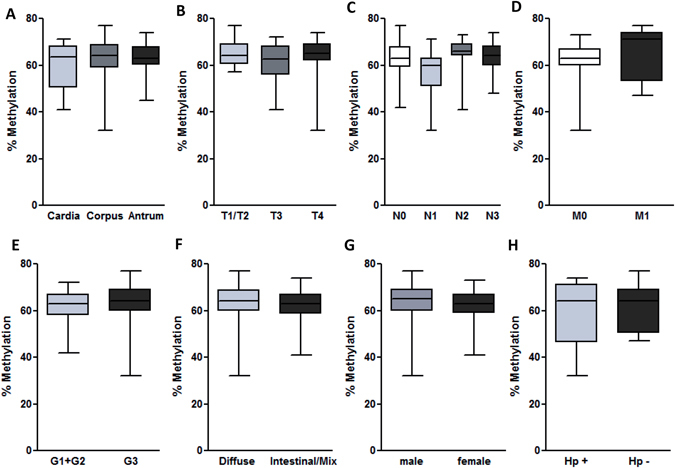
Figure 4.

Subgroup analyses of LINE-1 methylation in gastric cancer patients according to clinicopathological data. LINE-1 methylation analyses based on (A) anatomical tumour localization (p = 0.41), (B) T- (p = 0.20), (C) N-, (p = 0.11) and (D) M-tumor staging (p = 0.17). (E) LINE-1 methylation differences in patients with low and high-grade tumors (p = 0.26). LINE-1 methylation differences in GC patients according to (F) Lauren’s classification of GC type (p = 0.39), (G) gender (p = 0.83) and (H) H. pylori status (p = 0.70). Statistical analyses were performed using Mann-Whitney for two and Kruskal-Wallis test with Dunn’s posttest for multiple comparison analyses.
