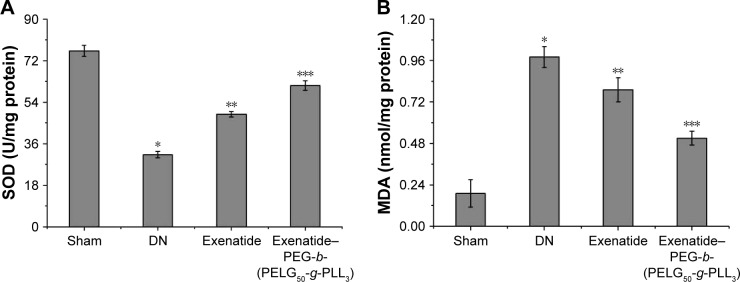
Figure 10.
SOD (A) and MDA (B). Renal tissues of rats from the sham, DN, exenatide, and exenatide–PEG-b-(PELG50-g-PLL3) complex groups were collected after eight weeks, and results are expressed as mean ± SD. (A) A significant decrease from the sham group, a significant increase from the DN group, and a significant increase from the DN (Exenatide-PEG-b-(PELG50-g-PLL3)) group is denoted by *P<0.01, **P<0.01, and ***P<0.01, respectively. (B) A significant increase from the sham group, a significant decrease from the DN group, and a significant decrease from the DN group is denoted *P<0.01, **P<0.01, and ***P<0.01, respectively.
Abbreviations: SOD, superoxide dismutase; MDA, methane dicarboxylic aldehyde; DM, diabetic nephropathy; PEG-b-(PELG50-g-PLL3), poly(ethylene glycol)-b-brush poly(L-lysine) polymer.

